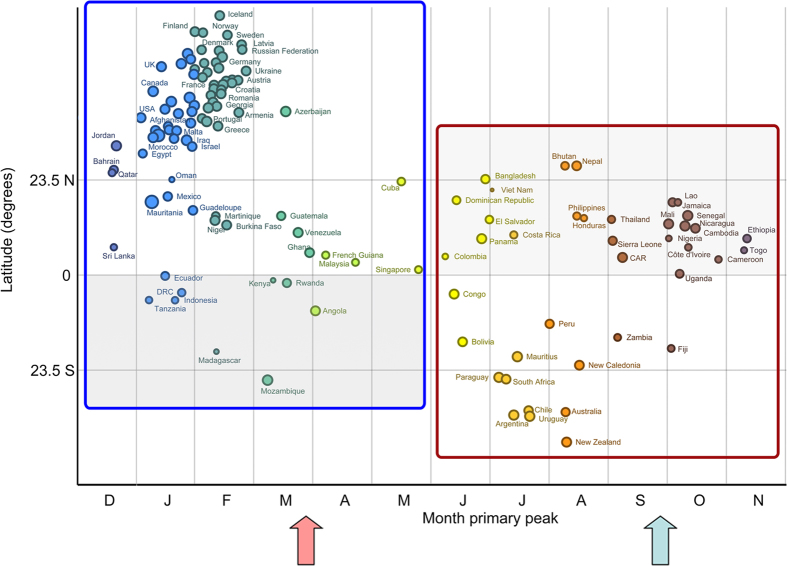
Figure 1. Timing of the primary peak of influenza detection (2010–2014), by country, against the latitudinal position of the capital city.
The size of points corresponds to the amplitude of influenza seasonality. Colors are used to highlight differences in peak timing. Arrows indicate the typical timing of delivery of the Southern Hemisphere (red) and Northern Hemisphere (blue) vaccines. Countries in the blue and red boxes should adopt the Northern and Southern Hemispheric vaccines, respectively. In each box the area with the darker background highlights countries that should opt for the vaccine recommended for the opposite hemisphere.

