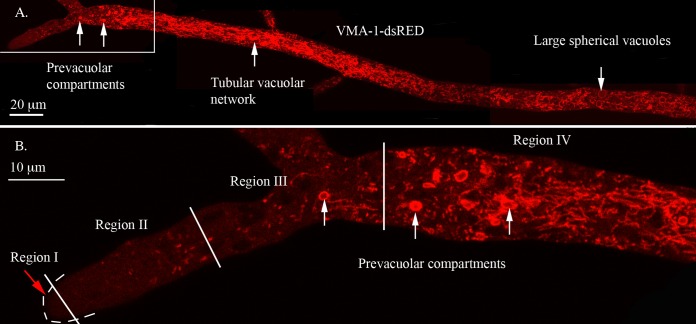
FIG 1.
Visualization of the vacuolar ATPase in different regions of the hypha. The hypha was transformed with VMA-1–dsRED. (A) Composite image made from four overlapping photos of the hypha. The structures seen in different regions are described in the text. (B) Enlargement of the boxed area of the hyphal tip in panel A. Regions I, II, III, and IV are separated by white lines, with white arrows pointing to examples of PVCs.

