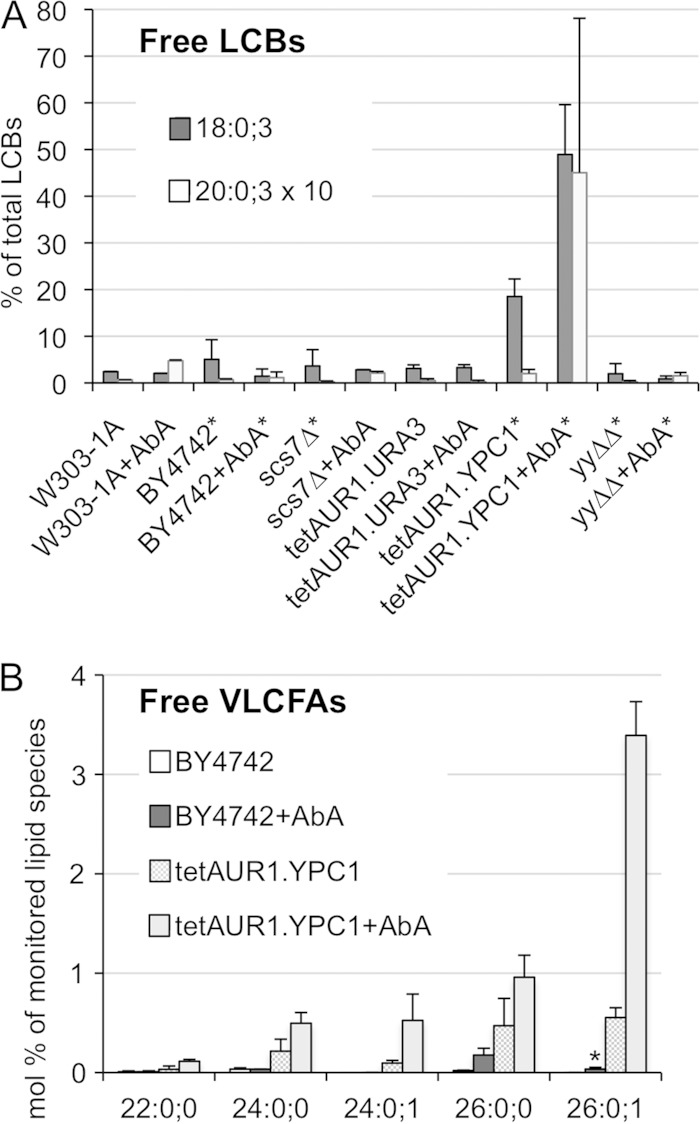
FIG 2.
Overexpression of YPC1 induces ceramide hydrolysis. The indicated strains were grown to an OD600 of 0.7 and extracted either directly or only after further growth in the presence of AbA (0.25 μg/ml) during 4 h. Lipid extracts from equal cell numbers were analyzed by MS. LCBs and VLCFAs are specified by 3 numbers indicating carbon atoms:double bonds;OH groups. (A) All intensities of LCB18:0;3 and LCB20:0;3 detected in the 6 strains, after subtraction of background, were summed and set as 100% and each species in each strain expressed as a fraction thereof. Summed intensities in LCB20:0;3 were only 6% of the total and therefore were multiplied by 10 for better visibility. Results for strains with an asterisk represent averages from two independent experiments and those for others represent a single one; two technical repeats were done in all cases. (B) Plot of the relative abundances (mole percent) of free VLCFA species that were present. Results represent averages from two independent experiments and two technical repeats for each.

