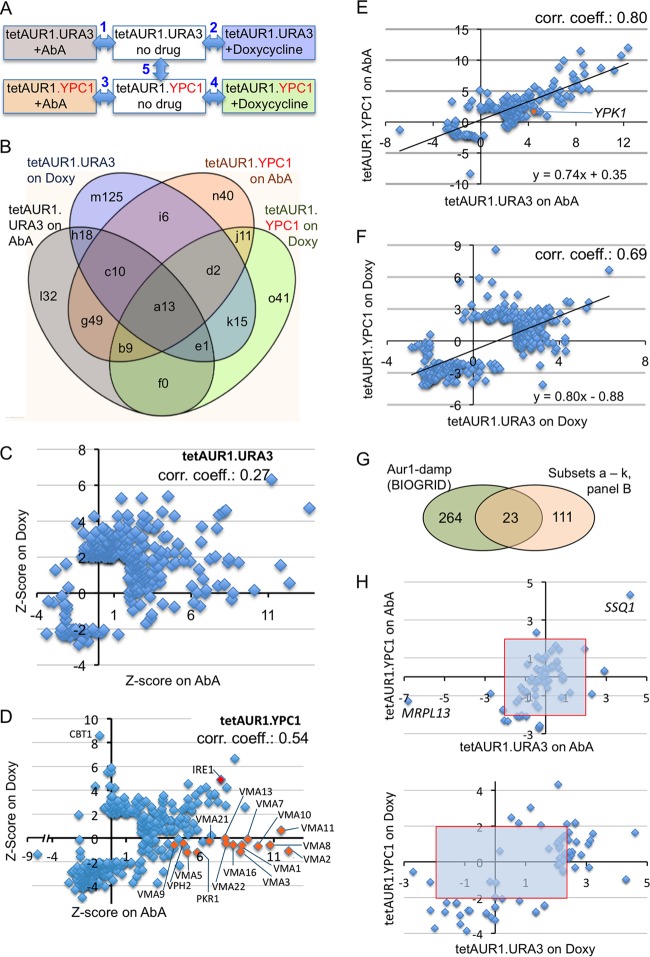
FIG 5.
Screens identifying gene deletions making cells sensitive or resistant to Aur1 repression. (A) Each of the 4,849 deletion strains was crossed with either tetAUR1.URA3 or tetAUR1.YPC1, and haploid progeny harboring a gene deletion, the tetAUR1 allele, and an URA3 plasmid were selected on plates supplemented with no drug, AbA, or Doxy. The relative growth of each mutant was determined by 5 binary comparisons between conditions linked by a double-pointing arrow. (B) Venn diagram classifying deletion mutants growing worse than average under AUR1 repression (positive Z scores) according to the screen(s) (comparisons 1 to 4 in panel A) that identified them. Different fields denoted by letters are referred to in the text and in Table S5 in the supplemental material and are followed by the number of negative interactors identified in this category. (C) For each deletion in the tetAUR1.URA3 background giving a significant interaction on at least one of the drugs (P < 0.05, |Z score| > 1.95), the Z scores on Doxy were plotted against the Z scores on AbA. (D) Same as for panel C but for deletions in the tetAUR1.YPC1 background. (E) Z scores in comparison 1 (panel A) plotted against their Z scores in comparison 3 for 174 mutants giving significant scores in either one of these screens. Twenty-nine strains giving a significant score in comparison 5 of panel A were excluded. (F) Same as for panel E but plotting scores in comparison 2 versus comparison 4 for 343 mutants after removal of 43 strains giving a significant score in comparison 5. (G) Venn diagram indicating overlaps between gene deletions causing significant growth retardation of hypomorphic aur1 alleles according to BIOGRID and the “high-confidence set” (panel B, fields a to k). (H) Z scores of tetAUR1.URA3 versus those of tetAUR1.YPC1 on AbA (top) and on Doxy (bottom) for deletions in mitochondrial genes.

