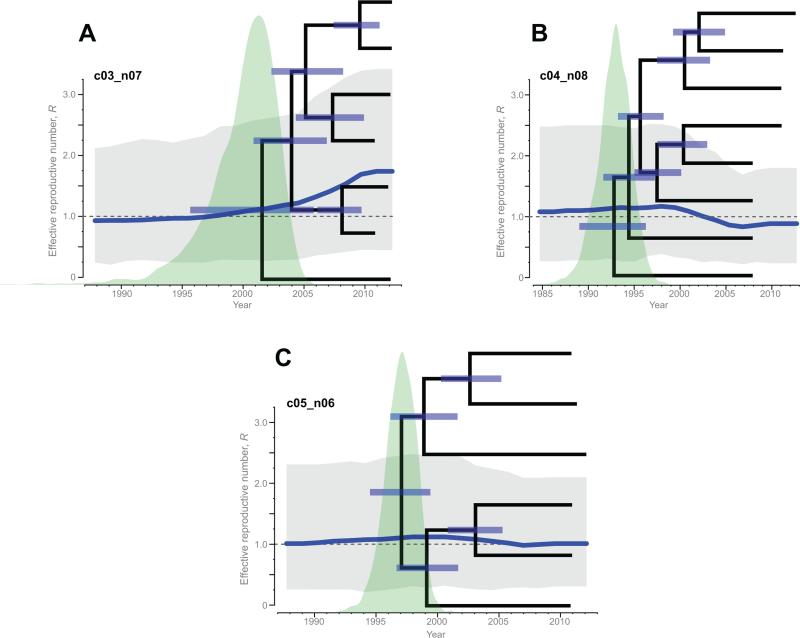
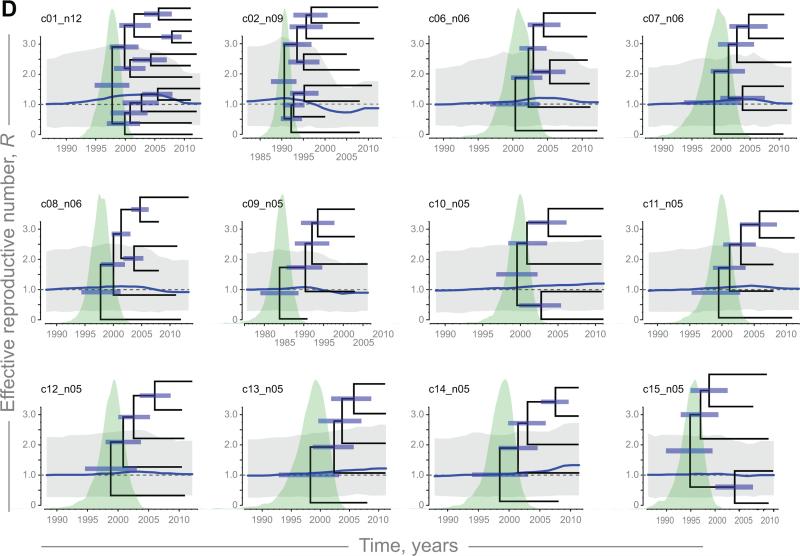
Figure 4.
Trajectories of effective reproductive number R (blue curves) with 95% HPD (gray polygons), and MCC time-trees within analyzed HIV sub-epidemics with 5+ members. A: Increasing R in cluster c03_n07. B: Declining R in cluster c04_n08. C: Fluctuating R in cluster c05_n06. D (next page): Fluctuating R in other 12 clusters.


