
Figure 1. Forest plot showing association between cancer risk and rs3184504 genotype in each data set.
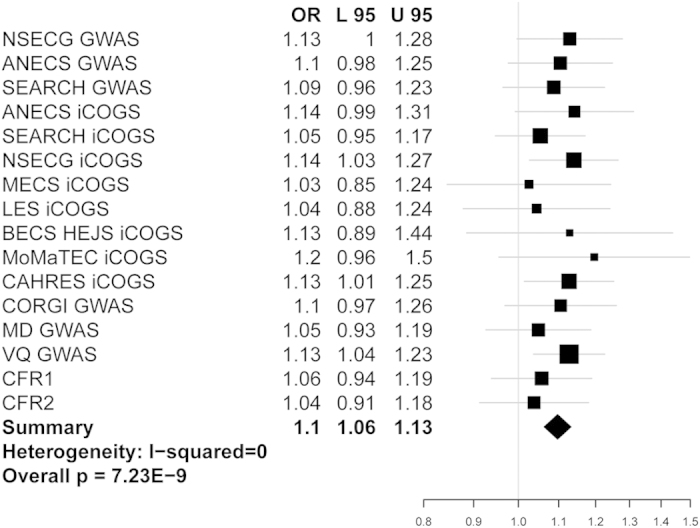
Studies are shown in order of EC GWAS, EC iCOGS and CRC GWAS (Table 1). Black squares represent the point estimate of the odds ratio and have areas proportional to study size. Lines represent 95% confidence intervals. The diamond shows the summary statistic. The overall heterogeneity statistic is shown. There is also no evidence of heterogeneity between the pooled CRC and pooled EC studies (details not shown).