
Figure 3. Forest plot showing association between cancer risk and rs12970291 genotype in each data set.
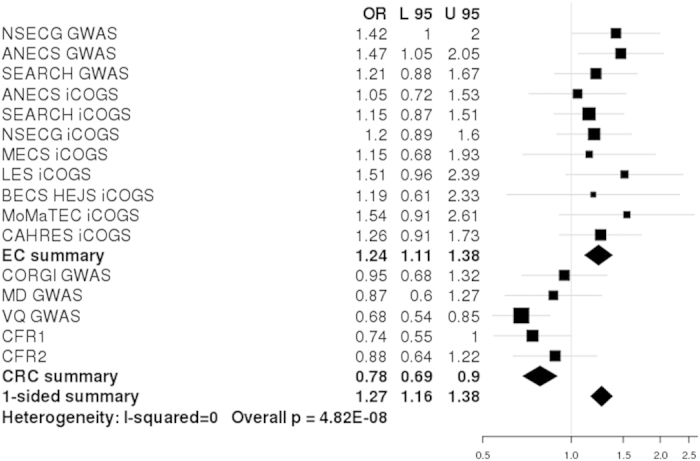
Legend is as for Fig. 1.
Official websites use .gov
A
.gov website belongs to an official
government organization in the United States.
Secure .gov websites use HTTPS
A lock (
) or https:// means you've safely
connected to the .gov website. Share sensitive
information only on official, secure websites.
Legend is as for Fig. 1.