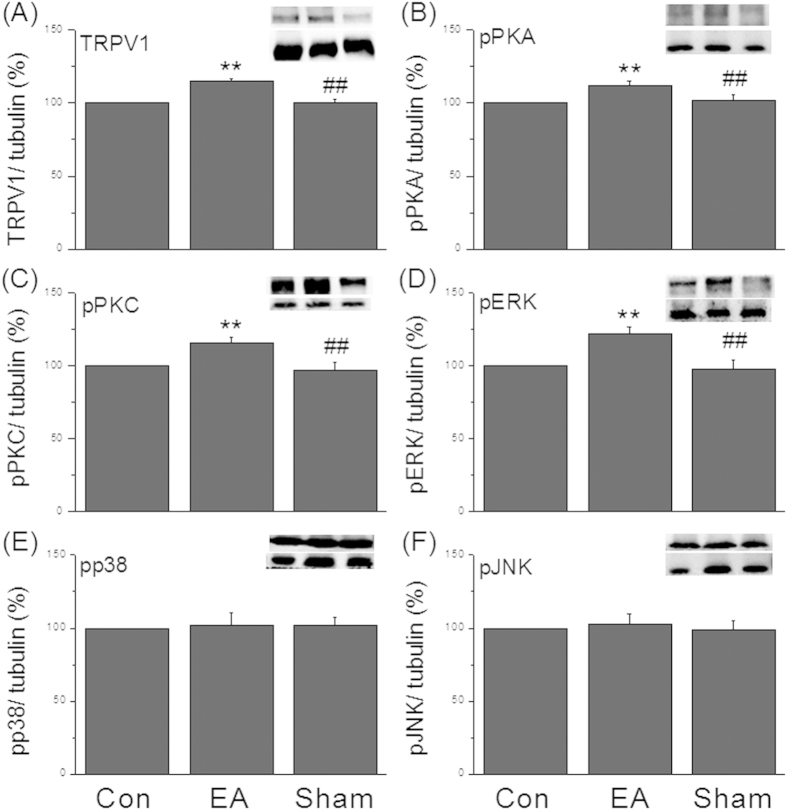
Figure 4. Upregulation of TRPV1 and relevant molecules in SC from EA but not sham-EA mice.
(A) Western blot staining showed TRPV1-positive band; (B) pPKA-positive band; (C) pPKC-positive band; (D) pERK-positive band; (E) pp38-positive band; (F) pJNK-positive band in Con, EA, sham groups. Con = control; EA = electroacupuncture; sham = sham-EA group.

