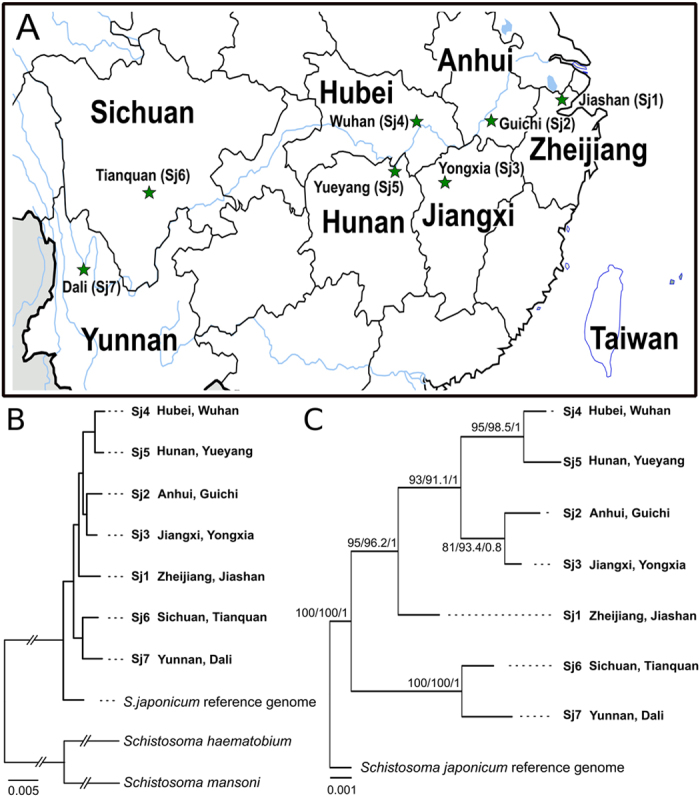
Figure 1. Phylogenetic relationships of seven Schistosoma japonicum populations from different parts of China.

(A) Map indicating the provenance of populations, and their relationships based on Bayesian inference (BI) analysis of (B) nucleotide sequence data representing 4,333 protein-encoding single copy orthologs (SCOs) or (C) four exonic regions within SCOs (designated Sjp_0006080, Sjp_0009700, Sjp_0068320 and Sjp_0102280). The topology of these BI trees (B,C) are the same as those obtained for independent analyses using the maximum parsimony (MP) and maximum likelihood (ML) methods. Absolute nodal support was achieved using each tree building method (B). Nodal bootstrap or posterior probability values are indicated in the following order: ML/MP/BI (C). Map was modified from https://commons.m.wikimedia.org/wiki/File:China_Heilongjiang_Shuangyashan.svg, and was originally created by Joowwww under the creative commons licence [ http://creativecommons.org/licenses/by-sa/3.0/legalcode] and distributed via Wikimedia Commons.
