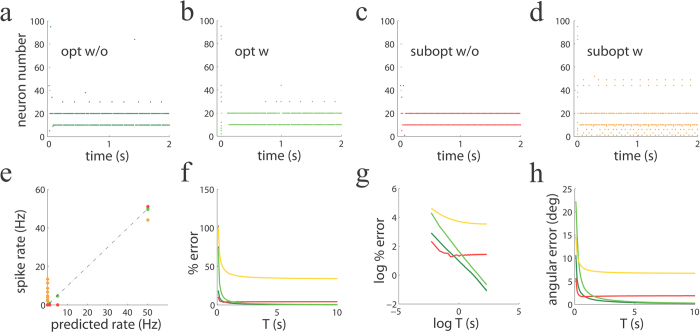
Figure 6. Performance of spiking networks for quadratic programming with optimal and suboptimal parameters.
(a–d) Population activity patterns over time for optimal networks (no leak present) without (a, opt w/o) and with synaptic delays (b, opt w), and for suboptimal networks (leak present) without (c, subopt w/o) and with such delays (d, subopt w/o). (e) The optimal network matches the optimal solution. Observed firing rate of the spiking network vs. the rate predicted from a non-spiking algorithm for the same problem (rate-based network algorithm) for the networks displayed in panels (a–d). Color code is the same as the first row. Dark green dots are overlaid by light green dots, and therefore they are invisible. (f) Percentage error decays to zero as a function of the integration window T for optimal networks, but not for signal-tracking networks. (g) Log-log plot of the previous panel. The percentage error decays approximately as 1/T for the optimal network, and saturates for the signal-tracking network. (h) Angular error as a function of the integration window T.

