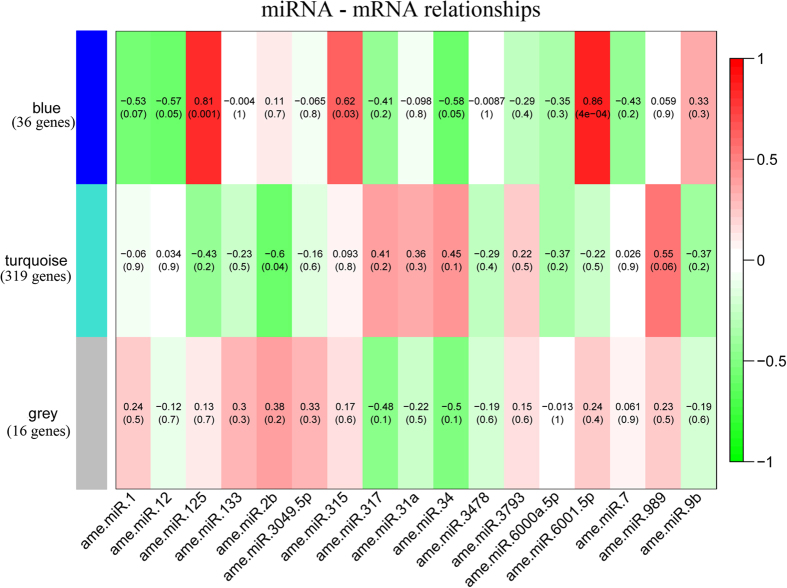
Figure 1. Associations between miRNAs and target genes at expression levels.
By co-expression analysis, 371 target genes of 17 miRNAs were clustered into three groups. 36 target genes showed co-expression and were clustered into group 1 (blue). Another 319 target genes showed co-expression and were clustered into group 2 (turquoise). The remaining 16 target gene did not show co-expression were clustered into group 3 (grey). If the target prediction is true, the miRNAs should be correlated with target genes at the expression levels. We then quantified the correlation between the each of miRNAs with three groups of target genes. Each row corresponds to a co-expressed gene group and each column corresponds to a miRNA. Each cell contains the corresponding correlation and p-value. The table is color – coded by correlation according to the color legend on the right side.

