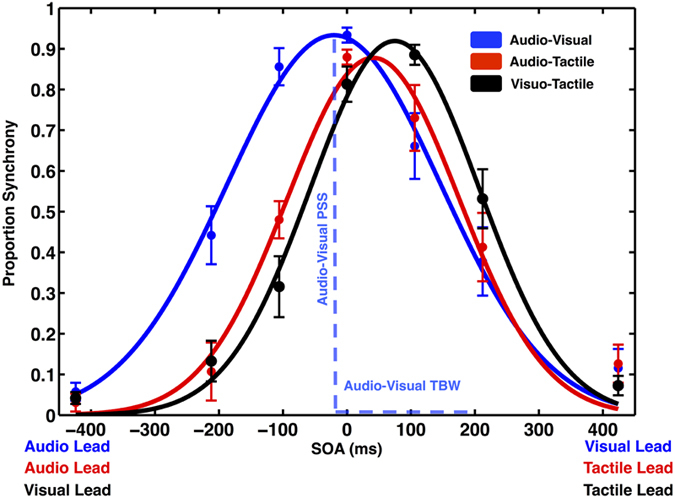
Figure 1. Simultaneity judgments for audio-visual, audio-tactile, and visuo-tactile pairs.

Proportion of synchrony reports are plotted as a function of Stimulus Onset Asynchrony (SAO) and stimulus pair, audio-visual (blue), audio-tactile (red), and visuo-tactile (black). Gaussian curves are fitted to raw data and represented as solid lines. Point of subjective simultaneity (PSS) and temporal binding window (TBW) are represented by the distribution’s mean and standard deviation parameters, respectively, as illustrated for the audio-visual pair. Error bars represent ± 1 SEM.
