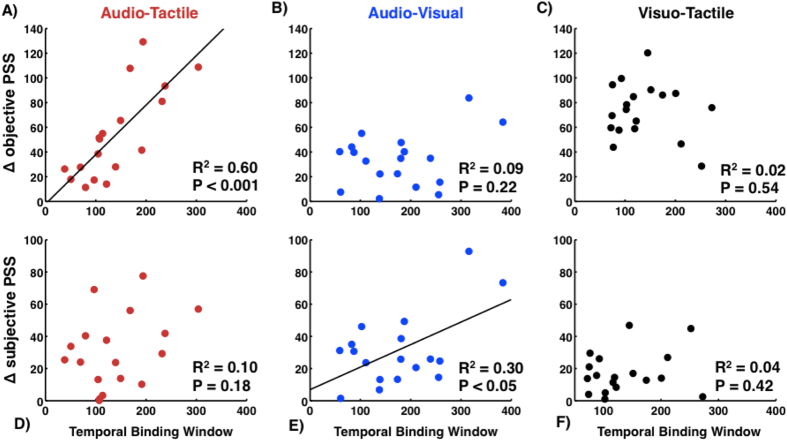
Figure 3. Relationship between TBW widths for different modality pairings and distance from true and perceived simultaneity.
Distance between the peak of simultaneity reports for individual participants and true synchrony (SOA = 0) is significantly correlated for the audio-tactile pair (A), but not the audio-visual (B) or visuo-tactile (C) pairs. Conversely, the distance between an individual’s PSS and mean perceived synchrony are correlated for the audio-visual (E) but not the audio-tactile (D) or visuo-tactile (F) pairs.

