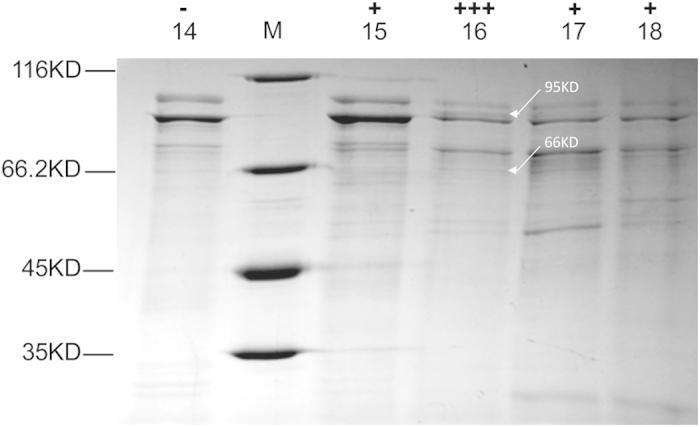
Figure 3. SDS-PAGE analysis of the protein fractions eluted from MonoQ HR 5/5 column. “−” represents this fraction has no LBS hydrolysis activity.

“ + ” represents positive in LBS hydrolysis. There are some comparatively thicker bands in the most active No.16 fraction, such as bands of approximate 95 kD and 66 kD indicated by arrows.
