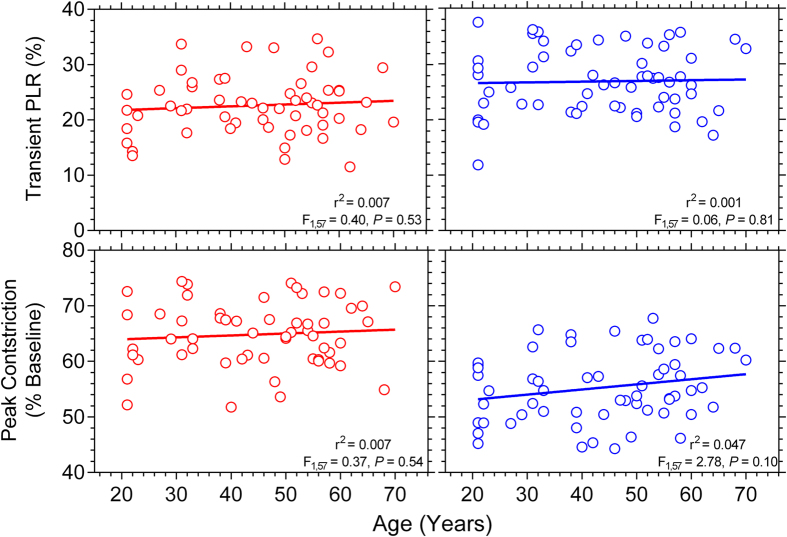
Figure 4. Relationship between age and the transient PLR (upper panels) and peak pupil constriction (lower panels) (n = 59 participants).
The red and blue circles indicate the response with red and blue lights, respectively; and the solid lines show the best-fitting linear regressions. The F-values indicate the slopes of the regression lines do not change as a function of age.

