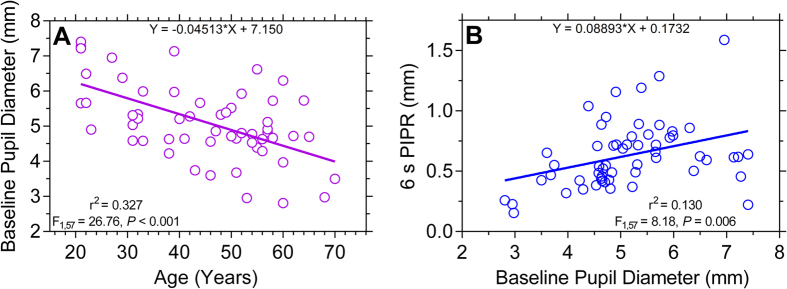
Figure 6. Relationship between the baseline pupil diameter (mm) and age (Panel (A)) and the 6 s PIPR (Panel (B)) (n = 59 participants).
The 6 s PIPR is given in mm (not % baseline as in the other figures) and a larger value indicates a larger PIPR. The F-values indicate the slopes of the regression lines are significantly different from zero.

