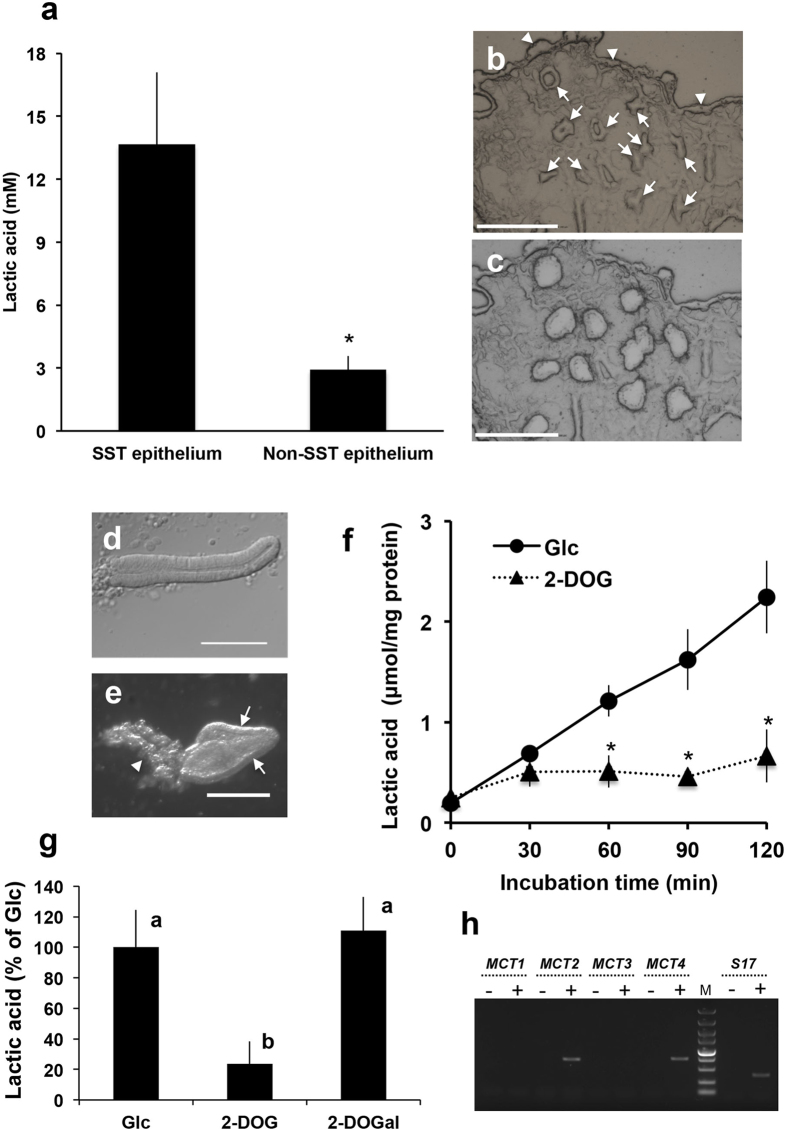
Figure 2. Sperm storage tubules produced large quantities of lactic acid.
(a) Lactic acid levels in sperm storage tubule (SST) epithelium extracts and surface epithelial cells (Non-SST epithelium) isolated by laser microdissection (LMD). Values shown are means ± SEM of four independent experiments. Lactic acid levels were significantly greater in the SST epithelium than in the Non-SST epithelium (P < 0.05). (b,c) Photographs of a cryosection of the utero-vaginal junction (UVJ) before (b) and after (c) LMD. Arrows and arrowheads in panel b indicate SSTs and Non-SST epithelium, respectively. Scale bar = 150 μm. (d) Photograph of SSTs isolated by collagenase digestion. Scale bar = 100 μm. (e) Photograph of non-SST cells isolated by collagenase digestion. Scale bar = 200 μm. Arrows and the arrowhead indicate surface epithelial cells and lamina propria, respectively. (f) Time-dependent release of lactic acid by cultured SSTs. Isolated SSTs were cultured in Hank’s balanced salt solution containing either 5 mM glucose (Glc) or 1 mM 2-deoxyglucose (2-DOG). The medium was sampled at the indicated times and the lactic acid levels of the samples were measured. Values shown are means ± SEM of three independent experiments. Asterisks indicate significant differences from Glc at each incubation time (P < 0.05). (g) SSTs produced lactic acid via glycolysis. Isolated SSTs were cultured in Hank’s balanced salt solution containing either 5 mM glucose (Glc), 1 mM 2-deoxyglucose (2-DOG) or 1 mM 2-deoxygalactose (2-DOGal). The medium was sampled at 60 min of incubation and the lactic acid levels of the samples were measured. Values shown are means ± SEM of three independent experiments. Different letters denote significant differences (P < 0.01). (h) Expression of monocarboxylate transporter mRNA. mRNA extracted from the UVJ was reverse transcribed, and an aliquot was subjected to PCR using the primer set (MCT1, MCT2, MTC3, MTC4 or S17) indicated at the top of the figure. For a non-RT control, mRNA from the UVJ was treated the same way, except reverse transcriptases (lanes -) were omitted. The representative gel of three independent experiments was shown. M, molecular weight marker.

