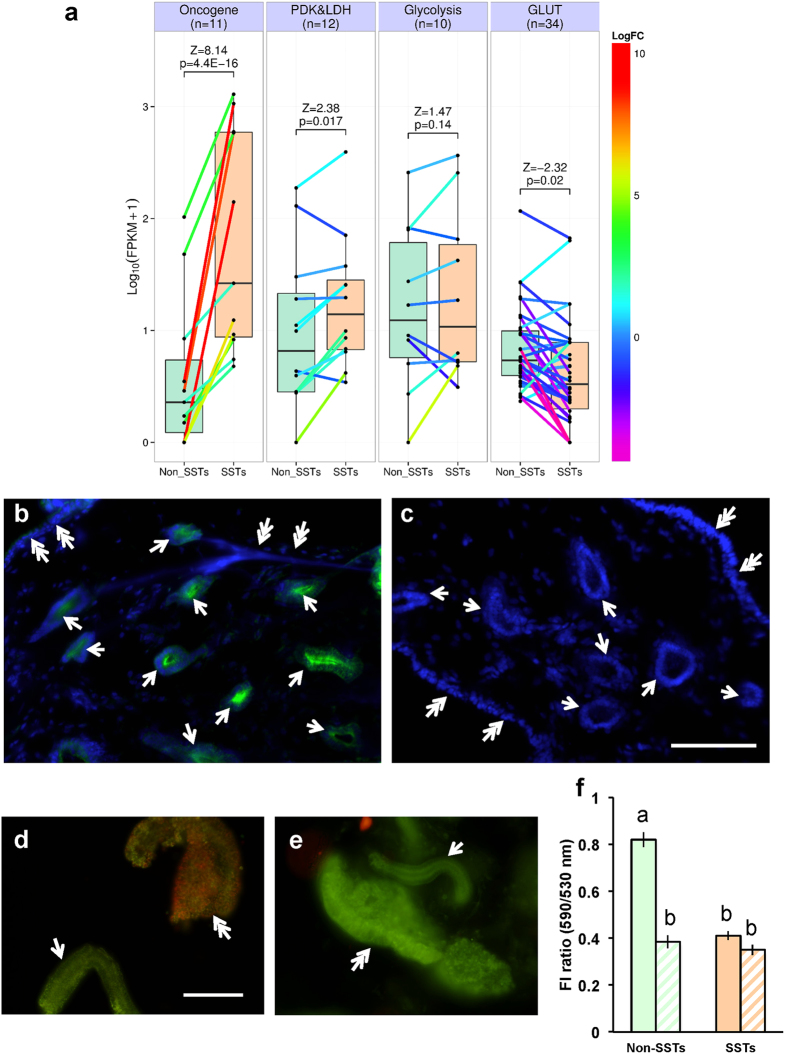
Figure 3. Sperm storage tubules were subjected to hypoxic conditions.
(a) Differential gene expression between the non-SST cells and SST cells. Box plots represent log10(FPKM + 1) gene expression levels for the functional gene sets related to oncogene, pyruvate dehydrogenase kinase and lactate dehydrogenase (PDK&LDH), glycolysis, and glucose transporter (GLUT) in non-SST cells (Non_SSTs) and SST cells (SSTs). Colored lines between the gene expression values in Non_SSTs and SSTs represent log2-fold changes (LogFC), with values indicated on the color scale to the left. n, numbers of genes in the functional gene sets; Z and p, Z scores and p-values, respectively, calculated by parametric analysis of gene set enrichment based on the logFC between Non_SSTs and SSTs. (b,c) Immunohistochemical detection of hypoxic cells. UVJ tissues isolated from birds injected with HypoxyprobeTM. (b) or saline (c) were stained with anti-pimonidazole antibody (green). The nuclei were counterstained with 4′,6-diamidino-2-phenylindole (DAPI; blue). Arrows and double arrows indicate SSTs and surface epithelium, respectively. Scale bar = 100 μm. (d,e) Mitochondrial activities of SSTs and surface epithelium assessed by JC-1 fluorescence in the presence (e) or absence (d) of an uncoupler. Surface epithelium displayed high mitochondrial activities (double arrow in panel (d)) while low mitochondrial activities were exhibited by SSTs (arrow in panel (d)). On the other hand, differences in mitochondrial activities between surface epithelium (double arrow in panel (e)) and SSTs (arrow in panels (e)) were absent in the presence of an uncoupler (panel (e)). Scale bar = 100 μm. (f) FI ratio (590 nm/530 nm) in the presence (hatched bars) or absence (solid bars) of an uncoupler. FI ratio indicated mitochondrial activity. Mitochondrial activities of SSTs were significantly lower than those of surface epithelium (Non-SSTs). Values shown are means ± SEM of three independent experiments. Different letters denote significant differences (P < 0.0004).

