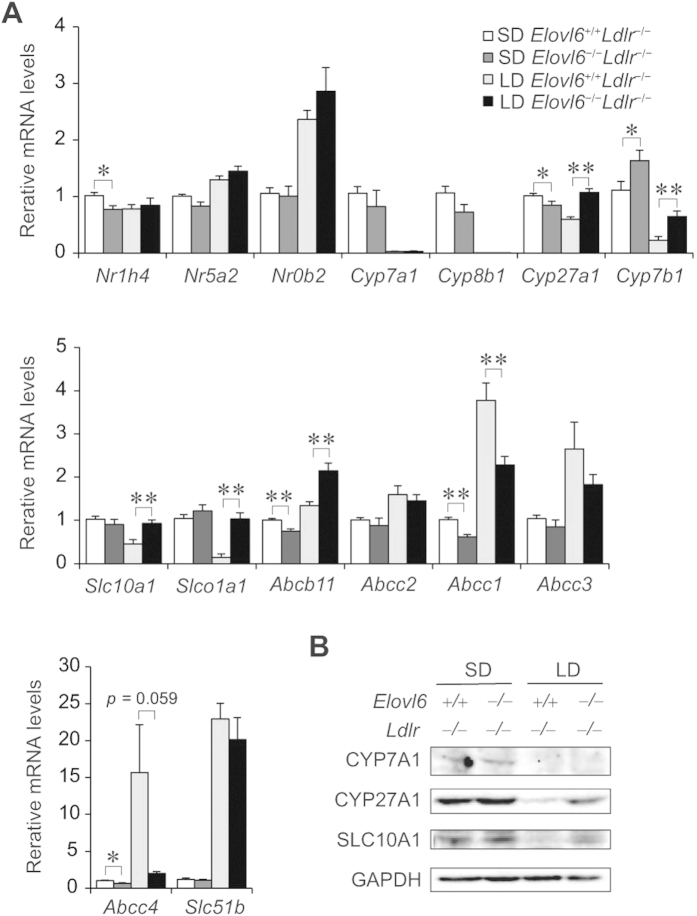
Figure 7. Hepatic expression levels of genes involved in BA metabolism.
Elovl6+/+Ldlr−/− and Elovl6−/−Ldlr−/− mice were fed a standard diet (SD) or a lithogenic diet (LD) for 4 weeks and sacrificed following 4 h of food deprivation (n = 8–13 per group). (A) qPCR analysis of genes for BA metabolism. *P < 0.05, **P < 0.01. (B) Immunoblot analysis of CYP7A1, CYP27A1, SLC10A1 and glyceraldehyde 3-phosphate dehydrogenase (GAPDH) in the livers of Elovl6+/+Ldlr−/− and Elovl6−/−Ldlr−/− mice fed a SD or a LD for 4 weeks.

