Figure 5.
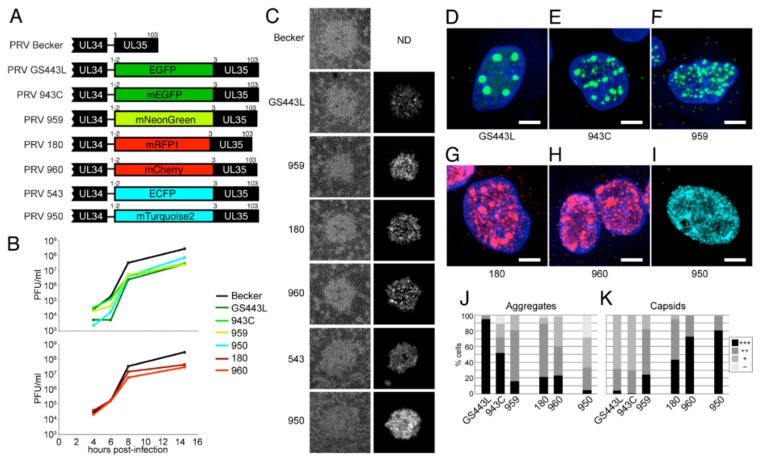
Fluorescent protein fusions to VP26, the small capsid protein, in pseudorabies virus (PRV). (A) Fluorescent protein coding sequences were inserted by homologous recombination between codons 2–3 of the PRV UL35 (VP26) gene. (B) Single-step virus replication. Parallel cell cultures were infected in triplicate with the indicated viruses, cells and supernatants were harvested at indicated times, and infectious virus titer was measured by plaque assay. Recombinants have ~1 log defect in end-point virus titer relative to parental PRV Becker. (C) Comparison of plaque size and fluorescence intensity. PK15 cells were infected with the indicated viruses, and one representative plaque is shown. Note that plaque sizes of recombinants are slightly smaller than that of parental PRV Becker. Newer FP variants are generally brighter than their predecessors: PRV 959 is brighter than PRV GS443L, and PRV 950 is brighter than PRV 543, but PRV 180 is similar to PRV 960. (D–K) Capsid assembly and nuclear aggregate formation. PtK2 cells (ATCC CCL-56) were infected with the indicated viruses, fixed at 6 h post-infection, and imaged by confocal microscopy. (D–I) Maximum intensity projection of representative nuclei containing individual fluorescent PRV capsids (smallest puncta) and large capsid protein aggregates (i.e., “assemblons”). Scale bars are 5 µm. (J–K) Quantification of intranuclear capsids and aggregates. More than 100 cells infected with each indicated virus were manually scored. (J) Intranuclear aggregates were scored as follows: +++, very large aggregates, as in panel D; ++, mid-sized aggregates, as in panels E-H; +, small aggregates, as in panel I; –, no aggregates. (K) Intranuclear capsid concentration was scored as follows: +++, dense, as in panels G-I; ++, many individual capsids, as in panel F; +, few individual capsids, as in panels D–E.

