Figure 1.
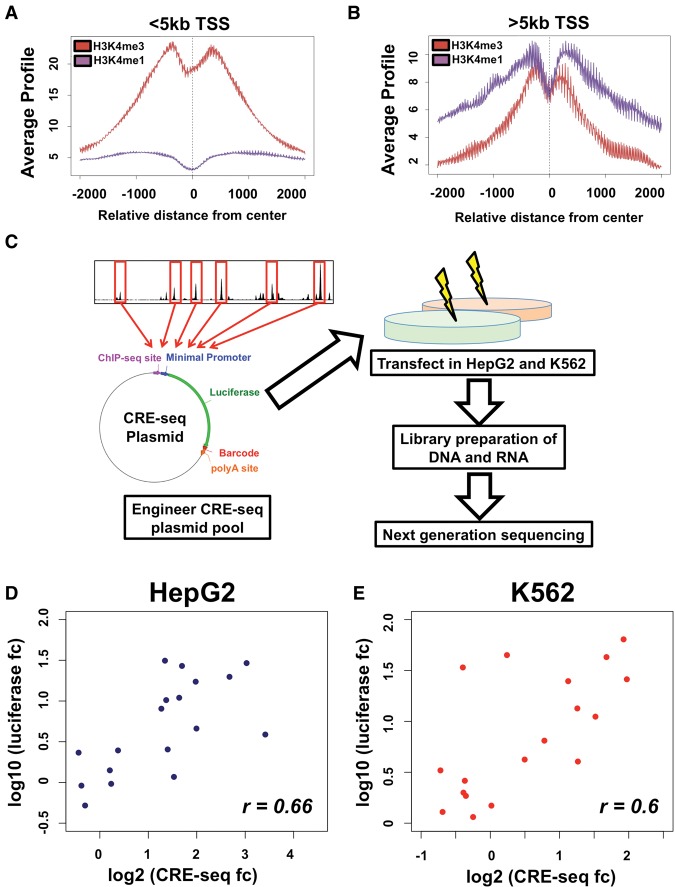
CRE-seq of CEBPB binding sites. Analysis of H3K4me1 (in purple) and H3K4me3 (in red) enrichment at CEBPB binding sites <5 kb from promoters (A) and >5 kb from promoters (B). Average ChIP-seq signal enrichment is displayed on the y-axis, whereas the distance from transcription start site (TSS) is displayed on the x-axis. At >5 kb from promoters, a substantial enrichment in H3K4me1 is observed. (C) Schematic of CRE-seq experimental platform. Oligonucleotides are generated harboring 120 bp of sequence centered on CEBPB binding site summits, unique 9-bp barcodes, and restriction enzyme sites for cloning. Oligonucleotides are cloned into a plasmid backbone, upstream of the backbone poly-A sequence, while a minimal promoter and luciferase coding sequence is subsequently cloned in between binding sites and barcodes within oligonucleotides, generating a pool of approximately 12,000 unique plasmids. HepG2 and K562 cells are transfected, in replicates, into HepG2 and K562 cells. DNA and RNA (cDNA) is extracted, barcodes from plasmids (DNA) and transcribed RNA molecules are amplified and prepared for next-generation sequencing. Regulatory activity for each barcode is determined by normalizing the RNA-derived barcode counts with counts from DNA (plasmids). The median activity across all barcodes for an individual element was used to determine activity in each replicate experiment. The mean activity across replicate experiments for each element was used to calculate the final activity. (D,E) Luciferase assay results in HepG2 (D) and K562 (E) cells are also displayed. The log2-transformed activity using luciferase assay (y-axis) and CRE-seq assay (x-axis) is shown (where fc denotes fold change). The Rank correlation for each data set is shown at the bottom right of each graph.

