Figure 2.

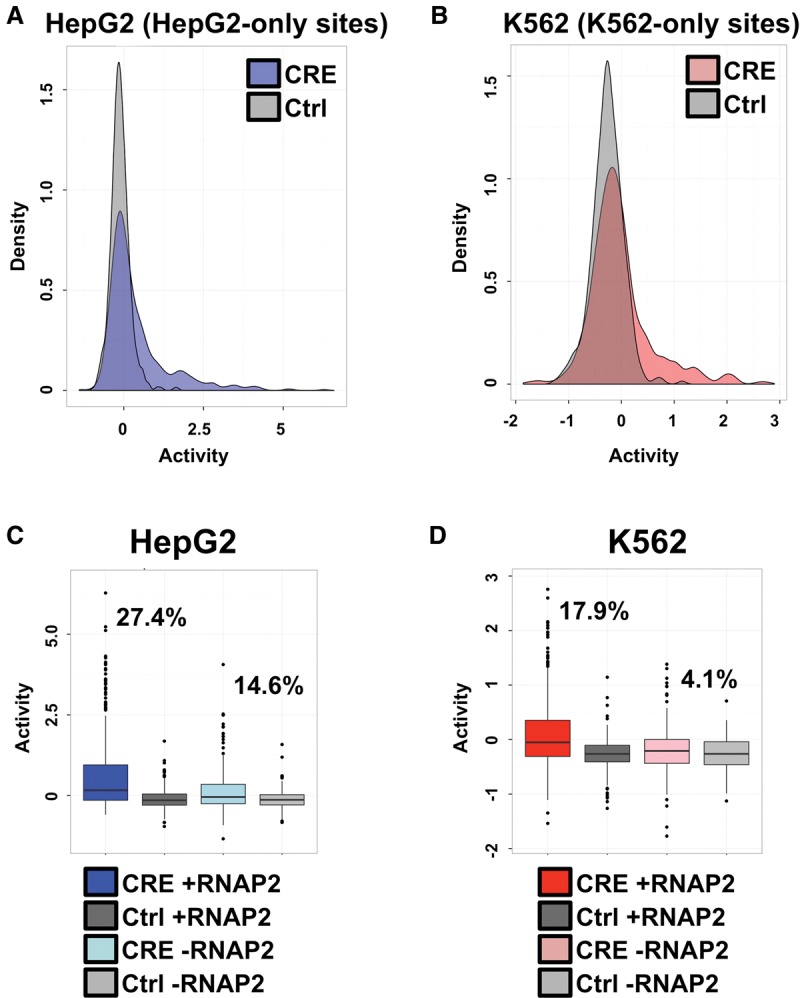
RNAP2-associated sites exhibit stronger activity. (A) Density plots of HepG2-specific CEBPB binding sequence activity in HepG2 cells. The x-axis displays the distribution of log2-transformed regulatory activity (RNA/DNA barcode counts), while the y-axis displays the density across distinct regulatory activities. HepG2 binding site CRE-seq activity distributions are shown in blue and compared with associated scrambled control sequence activities (shown in gray). (B) Density plots of K562-specific CEBPB binding sequence activity in K562 cells. The x-axis displays the distribution of log2-transformed regulatory activity (RNA/DNA barcode counts), while the y-axis displays the density across distinct regulatory activities. K562 binding site CRE-seq activity distributions are shown in red and compared with associated scrambled control sequence activities (shown in gray). (C) HepG2 CRE-seq activity for distinct classes of binding sites is shown as box plots. The log2-transformed CRE-seq activity (RNA/DNA barcode counts) is displayed on the y-axis. Binding sites that are coincident with promoter-distal RNAP2 are shown in dark blue, and the scrambled control sequences for these RNAP2-associated binding sites are displayed in dark gray. HepG2 binding sites devoid of promoter-distal RNAP2 binding are displayed in light blue, and the scrambled control sequences for these RNAP2-devoid sites are shown in light gray. The percentage of RNAP2-associated and RNAP2-devoid HepG2 sites above the 95th percentile of associated scrambled control sites are displayed on the plot. (D) K562 CRE-seq activity for distinct classes of binding sites is shown as box plots. The log2-transformed CRE-seq activity (RNA/DNA barcode counts) is displayed on the y-axis. Binding sites that are coincident with promoter-distal RNAP2 are shown in dark red, and the scrambled control sequences for these RNAP2-associated binding sites are displayed in dark gray. K562 binding sites devoid of promoter-distal RNAP2 binding are displayed in light red, and the scrambled control sequences for these RNAP2-devoid sites are shown in light gray. The percentage of RNAP2-associated and RNAP2-devoid K562 sites above the 95th percentile of associated scrambled control sites are displayed on the plot.
