
Figure 4.
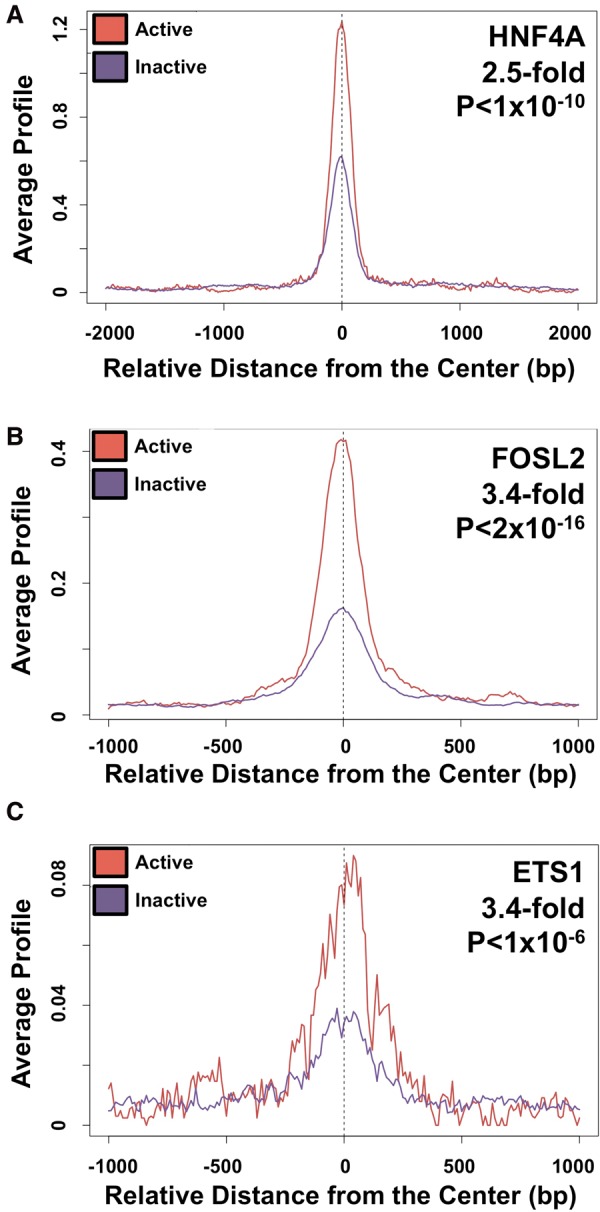
Motif and functional genomic analyses of CEBPB binding sites. (A) Motif analysis depicts enrichment for the HNF4A motif at active (in red) and inactive (in purple) CEBPB-bound sites in HepG2 cells. Motif fold enrichments and P-values are given in the top right. The location and orientation from the center of each element is shown on the x-axis. (B) Motif analysis depicts enrichment for the FOSL2 motif at active (in red) and inactive (in purple) CEBPB-bound sites in HepG2 cells. (C) Motif analysis depicts enrichment for the ETS1 motif at active (in red) and inactive (in purple) CEBPB-bound sites in K562 cells.