Figure 5.
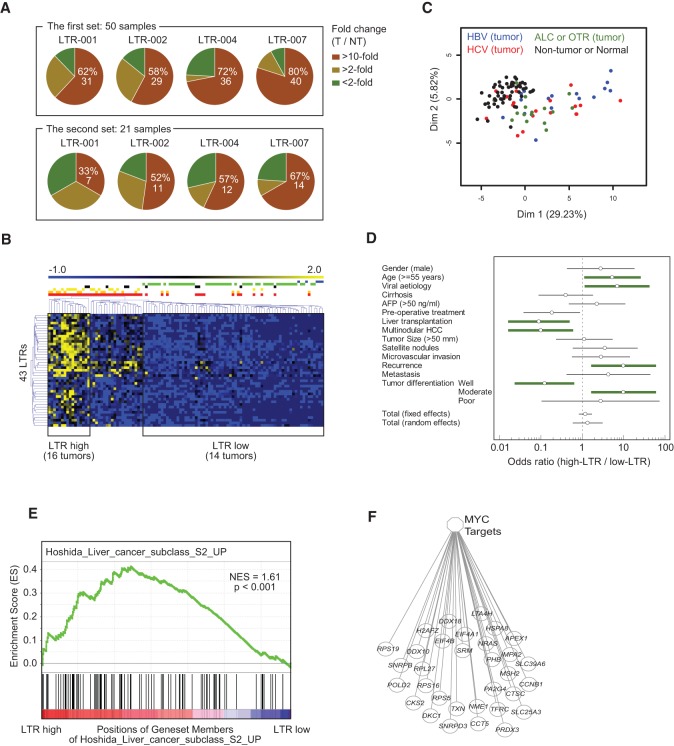
LTR promoters are frequently activated in human HCCs, correlating with viral etiology and aggressiveness. (A) Fold changes of LTR-001, 002, 004, and 007 in tumor compared to nontumor samples measured by qPCR in the working (first) and validation (second) set of HCC samples. (B) Unsupervised classification of HCC samples according to the expression profile of the 43 signature-LTRs using the MeV (MultiExperiment Viewer) software. Three (LTR-high, LTR-intermediate, LTR-low) distinct clusters are clearly visible. The LTR-high cluster included 16 tumor samples. The LTR-low cluster comprised 14 tumor, 50 NT, and five normal samples. (Blue) Normal liver, (green) NT, (black) alcohol, (yellow) HBV, (orange) HCV, (red) all tumors. (C) PCA based on the expression profile of 43 signature-LTRs. (D) Correlation between the indicated clinical parameters and the expression level of the signature-LTRs. Thick green lines: clinical features significantly associated with either the LTR-high or the LTR-low subclass according to the criterion FDR < 0.05. (E) Gene set enrichment analysis (GSEA) plot of HCCs related to LTR activity. Genes were rank-ordered according to differential expression between LTR-high and LTR-low HCC subclasses. The LTR-high HCC subclass revealed an enrichment of proliferative genes comparable to that of the S2 subclass of Hoshida et al. (2009). The black bars on the x-axis represent positions of gene set members on the rank ordered list of gene set Hoshida_liver_cancer_subclass_S2_up. The y-axis represents the enrichment score (ES) of the gene set Hoshida_liver_cancer_subclass_S2_up, in the subclass of samples LTR-high HCC. (NES) Normalized Enrichment Score; NES = ES/mean (all ES of other gene sets in MSigDB 4.0). (F) Enrichment plot showing an up-regulation of MYC target genes in the LTR-high subclass.

