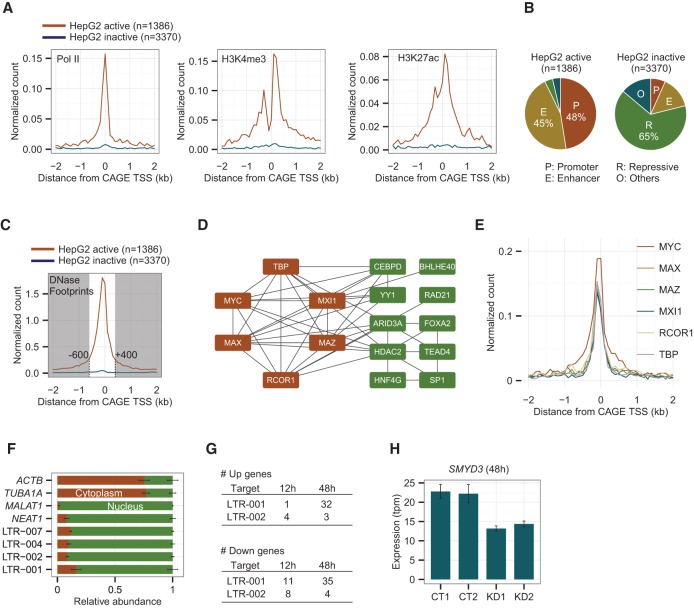
Figure 6.
A subset of up-regulated distal ncRNAs including LTRs and non-LTRs has active histone marks and TF binding sites in the HepG2 cell line. (A) Enrichment of ChIP-seq peaks for RNA Pol II, H3K4me3, and H3K27ac within 2 kb from the center of the CAGE peaks in 100-bp bins. The red and blue lines represent active and inactive peaks in the HepG2 cell line, respectively. (B) Chromatin states annotated by ENCODE based on combinatorial patterns of chromatin marks for the HepG2 active and inactive loci. (C) Distribution of DNase I footprints within 2 kb from the center of the CAGE peaks in 100 bp bins. (D) The co-occurrence of transcription factors at up-regulated distal ncRNA loci. Nodes are connected by a solid line if their Jaccard Index is above 0.5. Nodes shown in red are fully connected to one another. (E) Enrichment of ChIP-seq peaks for the fully connected six TFs within 2 kb from the center of the CAGE peaks in 100-bp bins. (F) Relative abundance of four LTR ncRNAs in nucleus and cytoplasm with ACTB, TUBA1A, MALAT1, and NEAT1 as cytoplasmic and nuclear controls. (G) Numbers of significantly up-regulated genes after 12 and 48 h of knocking down LTR-001 and 002. (H) Expression levels of SMYD3 measured by CAGE in CT (control) and KD (knockdown) samples at 48 h of the ASO treatment.

