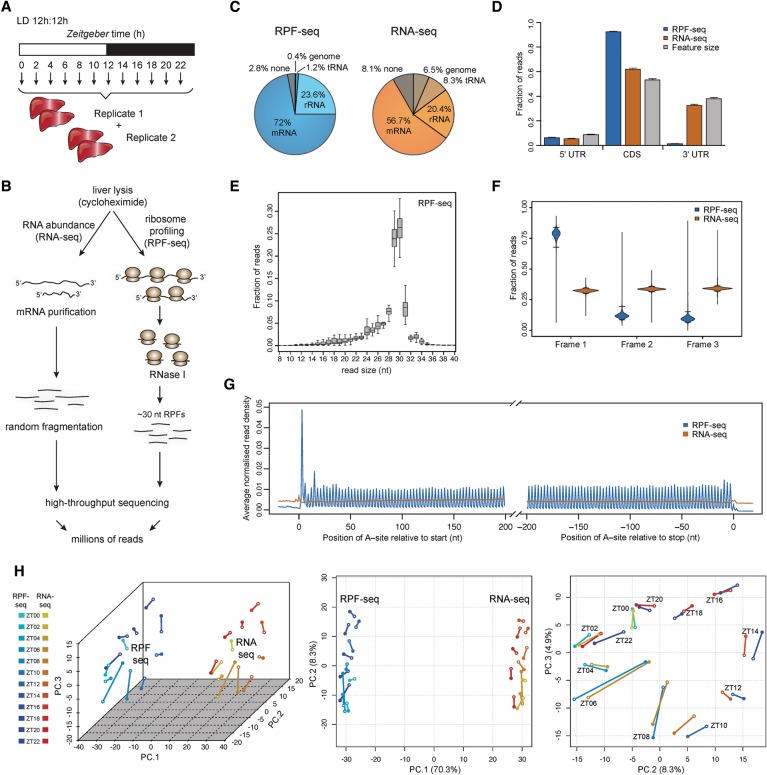
Figure 1.
Time-resolved ribosome profiling data from mouse liver. (A) Overview of the experimental design for liver sampling over the 24-h cycle of the day. Forty-eight livers were collected and assembled into two replicate time series of 12 timepoints around the clock (each sample representing a pool of two mice). (B) Overview of the main steps in the protocol for the preparation of RNA abundance (RNA-seq) and ribosome profiling (RPF-seq) data; for details, see Supplemental Material. (C) Mapping summary of RPF-seq and RNA-seq reads across all replicates and timepoints. Note that RPF-seq reads were enriched for mRNAs, as expected. For detailed mapping outcome, see Supplemental Table S1. (D) Read distribution within 5′ UTRs, CDS, and 3′ UTRs for RPF-seq (blue) and RNA-seq data (orange) compared with the distribution expected by chance, which is determined by the feature sizes (gray; N = 10829). Note the enrichment of RPF reads within CDS, the depletion from 3′ UTRs, and considerable amounts of reads (6%) within the 5′ UTR. (E) Insert size distribution of RPF-seq reads across all replicates and timepoints shows that the majority of footprints are 29–30 nt in length. Box-and-whisker plots: midline, median; box, 25th and 75th percentiles. Whiskers extend to the minimum and maximum values within 1.5 times the interquartile range from the box. (F) Frame analysis for RPF-seq and RNA-seq reads within the CDS (using genes for which the expressed transcript isoforms define one main translated CDS/protein—called single protein isoform genes—with an RPF-RPKM [reads per kilobase per million mapped reads] value >5 and fulfilled a few other minor criteria described in Supplemental Material; N = 3793). RPF-seq reads show a clear preference for reading frame 1 (the annotated frame), whereas RNA-seq reads distribute equally across the three reading frames, as expected. Violin plots extend to the range of the data, with horizontal lines marking the 2.5% and 97.5% quantiles. (G) Read density distribution of RPF-seq and RNA-seq reads within 200 nt from the start or −200 nt from the stop codons reveals a 3-nt periodicity of RPF reads within coding sequences. The analysis used only transcripts from single protein isoform genes (see F) with RPF-RPKM > 5 and CDS > 400 nt (N = 3237) and quantified the number of reads per nucleotide based on the A-site prediction as described in the Supplemental Material. (H) Principal component (PC) analysis of RPF-seq and RNA-seq data sets, using the top-ranked 4000 genes (see Supplemental Methods). The first three PCs explain 70.3%, 8.3%, and 4.9% of total variation, respectively (3D scatter plot, left panel). While PC1 mainly reflected variance attributable to differences between the mRNA abundance and footprint data sets (middle panel), PC2 and PC3 resolved mainly variance attributable to factor time (right panel). Note that the timepoints assemble to a near-perfect “clock” in the PC2 versus PC3 representation. A scree plot showing contributions of further PCs can be found in Supplemental Figure S1D.

