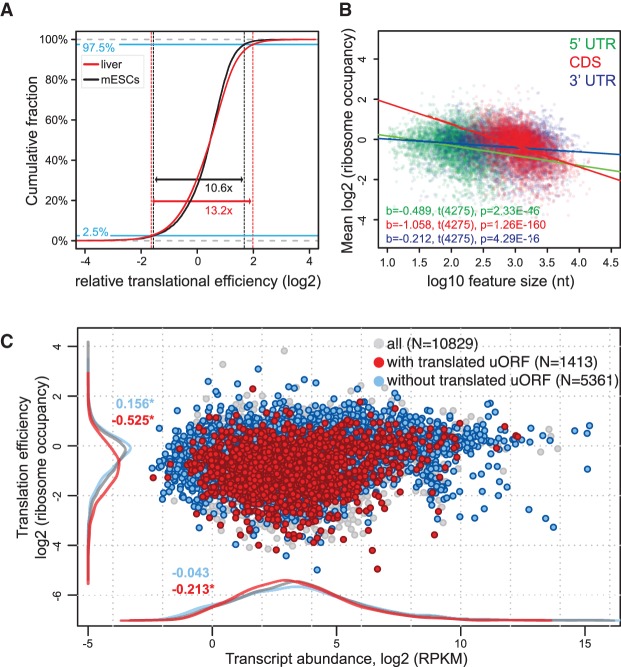
Figure 2.
Analysis of translation efficiencies in mouse liver. (A) TE distribution in mouse liver (red curve; representing all 24 ZTs from 10829 genes, i.e., N = 129870 individual data points) compared with that in mESCs (black curve; data from Ingolia et al. 2011; N = 10217 genes). Liver data were adjusted for mean to ensure comparability with mESC data. The asymmetrical nature of the TE distribution that has previously been reported for mESCs and that is indicative of an intrinsic upper limit to translation rates (Ingolia et al. 2011) is also observed in the liver. Note that the TE range is significantly broader in the liver, where 95% of data fall into a 13.2-fold TE range, compared with a 10.6-fold range in mESCs (P < 2 × 10⁻⁵, permutation test). (B) Correlation between TEs and 5′ UTR, CDS, or 3′ UTR lengths. Analysis was performed on transcripts from genes for which the transcriptomics analysis showed that a single protein isoform was produced, and that had an RNA-seq RPKM value >5, and 5′ and 3′ UTR lengths ≥10 nt (N = 4277). Linear regression lines for each group are plotted over the data points, and related t-test results of the regression slopes are reported in the plot area with the same color code. Inverse and statistically significant correlation between TE and feature length was thus apparent for all three features, with predictive value CDS > 5′ UTR > 3′ UTR. (C) Scatter plot of TEs (ordinate) versus transcript abundances (TAs; abscissa) averaged over timepoints and replicates. Highlighted are transcripts from single protein isoform genes, which do (red) or do not (blue) contain at least one translated AUG-initiated uORF. Density curves of TEs and TAs for highlighted data points are plotted on the margins with same color code. uORF translation is thus associated with a pronounced TE decrease and a slight decrease in transcript abundances. Numbers on density curves reflect the location shift (log2 values of the median calculated from the differences across all timepoints) relative to all transcripts. Transcripts with translated uORF: TE, P < 2.2 × 10⁻¹⁶; TA, P = 1.3 × 10⁻⁵ (Wilcoxon rank-sum test). Transcripts without translated uORF: TE, P < 2.2 × 10⁻¹⁶; TA, P = 0.287 (Wilcoxon rank-sum test).

