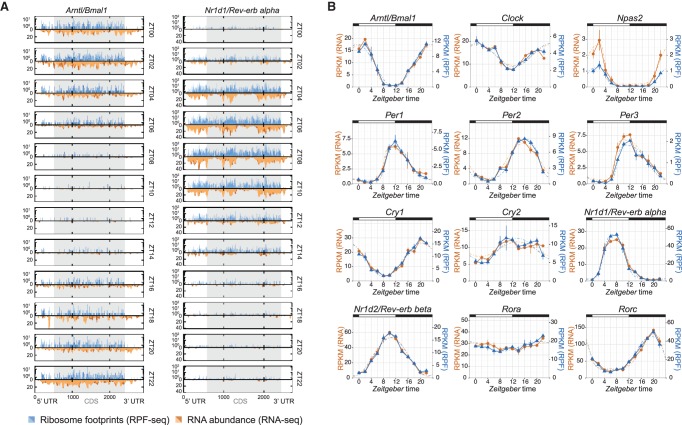
Figure 3.
Core clock transcripts show mRNA abundance and ribosome occupancy in sync. (A) Time-resolved distribution (ZT00 to ZT22; arranged vertically) of normalized counts of ribosome profiling (RPF-seq; blue) and RNA abundance (RNA-seq; orange) reads along the Arntl/Bmal1 and Nr1d1/Rev-erb alpha transcripts. Different color shadings (dark/light orange and blue) indicate the two biological replicates. Gray shading of the boxes marks the CDS; UTRs are in white. (B) RPKM values of CDS-mapping RPF-seq (blue) and RNA-seq (orange) data for circadian core clock genes around the 24-h daily cycle. Means per timepoint are plotted; error bars, the two biological replicates. Dashed lines represent rhythmic curve fittings to the data.

