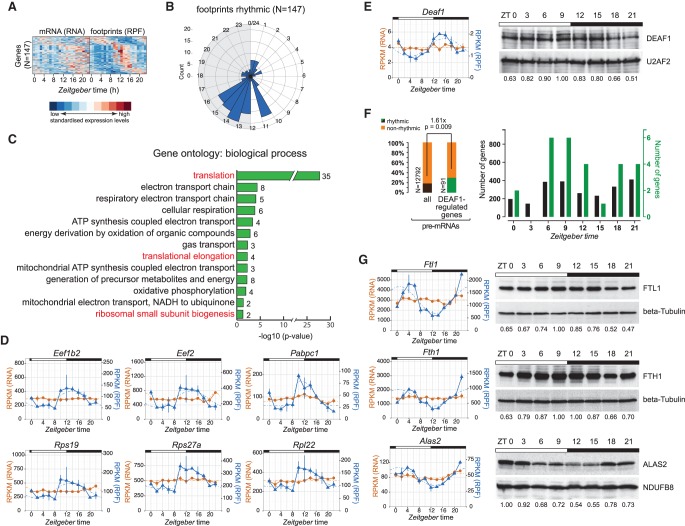
Figure 5.
Daytime-dependent translational control of protein biosynthesis machinery components, of transcription factors, and in iron metabolism. (A) Heat map of “mRNA flat–footprints rhythmic” genes identified after Babel analysis (significant changes in ribosome occupancy) showing the mRNA abundance (RNA-seq; left) and footprint (RPF-seq; right) data for 147 genes. Transcripts are sorted by the phase of maximal ribosome occupancy. For the representation, mRNA abundances and translation levels are standardized within each gene (row) and independently for RNA-seq and RPF-seq columns (Z-scores). Note that this high-confidence set of 147 transcripts has clear rhythms at the translational level, but not so at the mRNA abundance level. (B) Phase histogram showing the phase distribution of footprint data across the 24-h cycle. Generally, there was a strong enrichment of ribosome occupancy maxima at the light-to-dark transition. This distribution is significantly nonrandom (P = 1.12 × 10⁻¹⁰; R = 0.395; Rayleigh uniformity test) and significantly different from those in Figure 4C (P < 7.6 × 10−08; W = 32.80; Watson–Wheeler test for homogeneity of angles). (C) Gene ontology (GO) analysis of biological process based on genes detected in A. Bar graph shows log10 of P-values for each category. Numbers next to the bars represent the number of genes within each category. Marked in red are the GO terms connected to the protein biosynthesis machinery. (D) RPF-seq (blue) and RNA-seq (orange) profiles for several rhythmically translated transcripts connected to the protein biosynthesis machinery—ribosomal proteins, translation factors, and poly(A) binding proteins—around the 24-h cycle. Means per timepoint are plotted; error bars, replicates. Dashed lines represent rhythmic curve fittings. (E, left) RNA-seq (orange) and RPF-seq (blue) profile as in D for transcription factor Deaf1 around the clock. (Right) Western blot analysis for DEAF1 (and loading control U2AF2) in liver nuclear extracts. Numbers below the panels show relative levels of DEAF1 protein after normalization to U2AF2. Data from one representative time series are shown (N = 2). (F, left) Rhythmically transcribed genes (from Du et al. 2014) are 1.6-fold enriched in DEAF1-regulated genes (Fisher's exact test P = 0.009) (Yip et al. 2009), consistent with the idea that rhythmic translation and protein accumulation of DEAF1 leads to rhythmic transcriptional activity on its target genes. (Right) Peak abundances of rhythmically transcribed genes around the clock. (Black) All rhythmically transcribed genes; (green) rhythmic DEAF1-regulated genes. (G, left) RNA-seq and RPF-seq profiles for Ftl1, Fth1, and Alas2, similar as in D. Note the high-amplitude rhythms in translation from flat mRNAs. (Right) Confirmation of protein rhythmicity by Western blot analysis of total protein extracts (FTL1, FTH1) or mitochondrial extracts (ALAS2) prepared from mouse liver. Protein levels were normalized to beta tubulin or NDUFB8, respectively. Protein data from one representative time series are shown (N = 2–3).

