Figure 1.
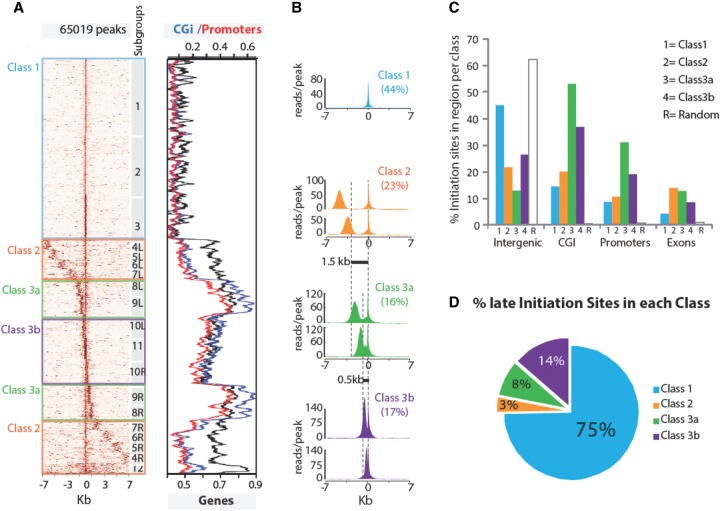
Three classes of replication origins. (A) Clustering of origins based on read densities around peaks. The left panel displays a heatmap of read densities in 7-kb regions on each side of the peak summit. It shows how an IS is positioned relative to its neighbors and indicates the signal strength (number of reads) and density at each IS. The brown intensity is proportional to the read counts per 100-bp bins. The numbers on the right of the heatmap indicate groups obtained by k-means clustering, and the left/right symmetry between cluster pairs is denoted by identical numbers followed by the L and R suffixes. The three classes of origins defined in the text are highlighted in boxes. The right panel indicates the overlap of IS (± 500 bp from the summit) with CpG islands (blue), promoters (red), and genes (black). (B) Read density mean profiles per class of origins. Each class is defined by assembling groups of IS characterized by a specific distance (dotted vertical lines) between two major IS, except for Class 1 origins, which have a single IS within a 14-kb region. The y-axis represents the average number of reads per peak. Class 1 profile is represented by subgroup 1; Class 2 by subgroups 5LR, 6LR; Class 3a by subgroups 8LR, 9LR; and Class 3b by 10LR, 11. (C) Genomic localization of origins. For each class, the bar plot indicates the proportion of IS associated with intergenic, CGi, promoters, and exons. (D) Distribution of late origins per class. The percentage of IS overlapping with the late-replicating regions defined in Hiratani et al. (2008) (Supplemental Table S1) is indicated for each class.

