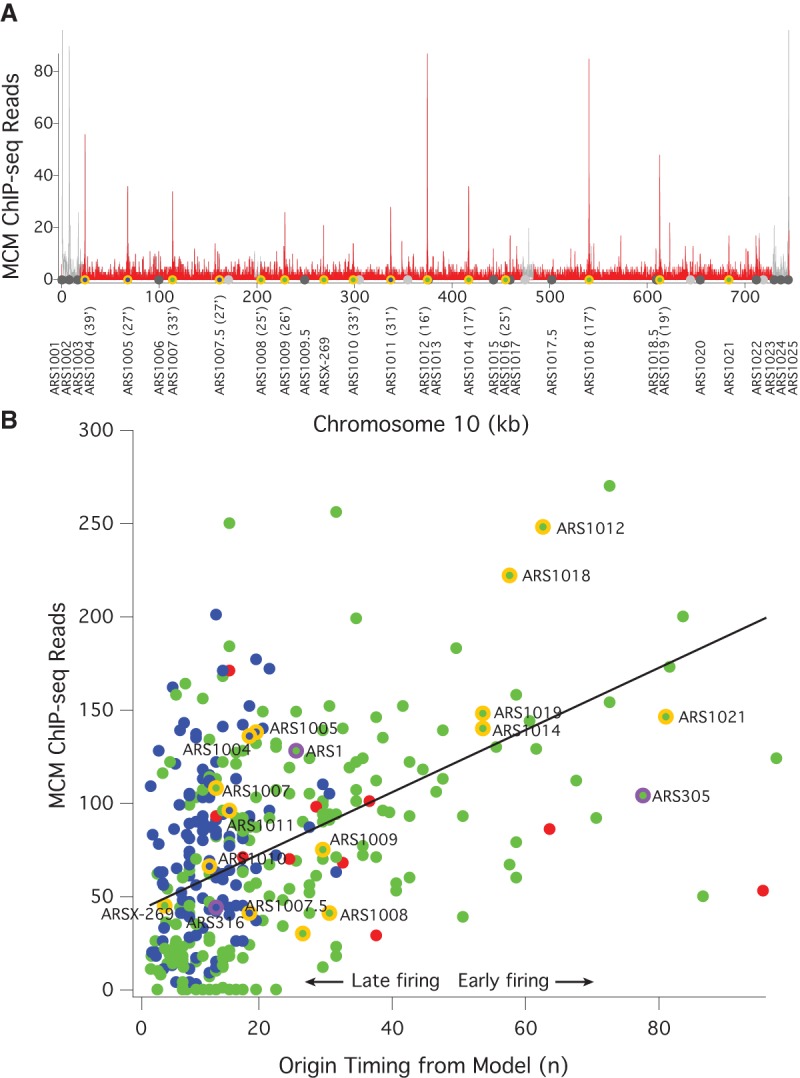
Figure 1.

MCM ChIP-seq signal correlates with origin firing time. (A) Frequency of MCM ChIP-seq reads in 100-bp bins on Chromosome 10 from α-factor-arrested wild-type cells (yFS661). The red histogram represents uniquely mapped reads; the gray histogram represents multiply mapped reads that cannot be specifically placed at any one locus, but which demonstrate a high level of telomeric MCM binding. The locations of origins shown in B are shown with the color code used there. The firing time of these origins is given after their names. The locations of other confirmed or suspected origins (Siow et al. 2012) are indicated in dark gray and light gray, respectively. These origins are not included in B because they were not captured by the model used to determine n (Yang et al. 2010). (B) The correlation between the firing time of origins, as determined by the firing-time parameter n from a quantitative analysis of replication kinetics (Yang et al. 2010) and the number of MCM ChIP-seq reads in a 1-kb window around those origins. Blue dots represent origins repressed by telomere proximity (Lian et al. 2011), Rpd3 (Knott et al. 2009) activity, or Fkh1 (Knott et al. 2012); red dots represent centromeric origins and other origins activated by Ctf19 (Natsume et al. 2013); green dots represent all other origins. Chromosome 10 origins are indicated in orange; the origins used in Figure 2 and Supplemental Figure S2 are indicated in purple. ARS1004 is repressed by telomere proximity (Lian et al. 2011); ARS1005, ARS1007.5, and ARS1010 are repressed by Rpd3 (Knott et al. 2009); ARS1011 is repressed by Fkh1 (Knott et al. 2012). The line represents the best linear fit to the green dots (r = 0.54).
