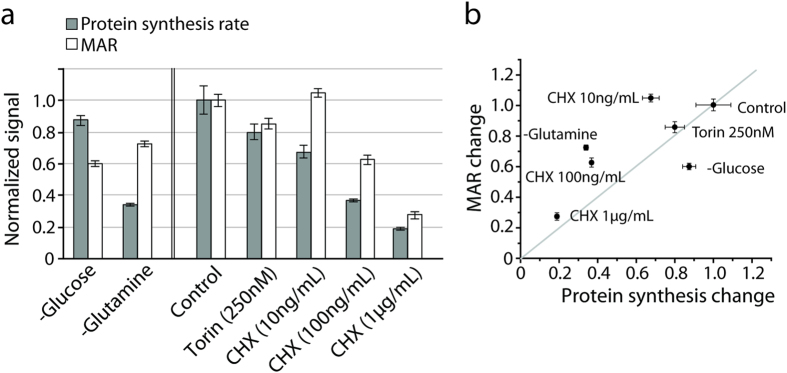
Figure 4. Growth can be temporarily decoupled from protein synthesis upon nutrient depletion.
(a) Grey columns indicate normalized protein synthesis rate measured by radiolabel incorporation. White columns indicate normalized MAR measured by the SMR. Following glucose or glutamine depletions, both protein synthesis and MAR were measured for 30 minutes immediately after depletion. Following drug treatment, protein synthesis and MAR were measured 2 hours after inoculation. MARs were determined over a 15-minute interval in each condition. The mean MAR was normalized by the mean MAR of untreated cells. Number of cells measured in the SMR is 84 (control), 68 (Torin 250 nM), 67 (CHX 10 ng/ml), 89 (CHX 100 ng/ml), 53 (CHX 1ug/ml). Error bars indicate the variation of mean from triplicate measurement (protein synthesis) or standard error (mass accumulation rate). (b) The results in (a) are plotted to show the relationship between reduction in MAR and protein synthesis.

