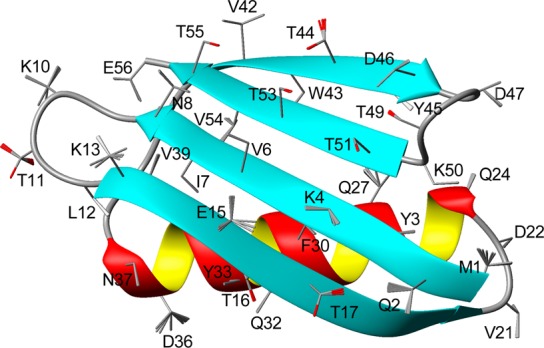
Figure 3.

Structure of GB3, derived from NMR data. The backbone coordinates are presented as a ribbon diagram, with side chains depicted as sticks for the Cα–Cβ and Cβ–Cγ1 (Cβ–Oγ for Thr) bonds. For residues with the RDC-derived χ1 rotamer distributions, shown positions of the side chains (stick models) are obtained by 20 random samplings from the models reported in Table 1. Spread within each rotamer corresponds to the Monte Carlo-derived rms uncertainty of the best-fitted χ1 values as reported in Table 1.
