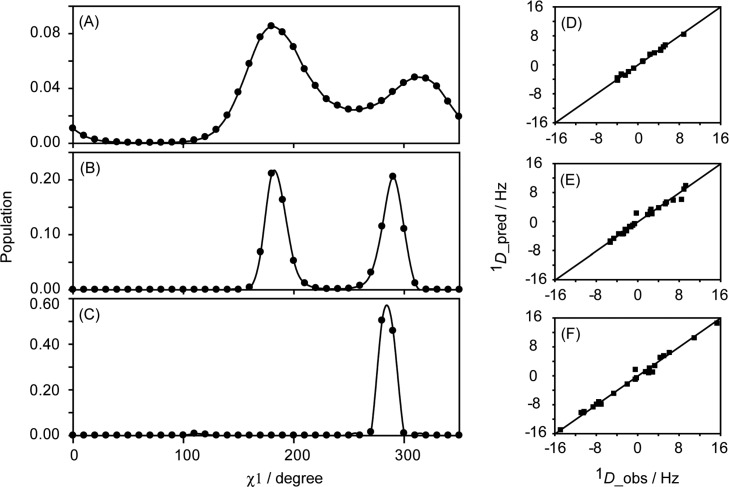
Figure 4.
Distributions of χ1 torsion angles for the three Asn residues in GB3, derived from RDC data, (A) Asn8, (B) Asn35, (C) Asn37 obtained with the program VW-Fit from an ensemble of 36 conformers, with identical backbone coordinates but the side chain χ1 angles ranging from 0° to 350° in 10° increments. Corresponding distributions for all residues are presented in SI Figure S6. The positive weight of the entropy term, θ, was adjusted such as to increase the total RDC component of the error function (eq 1) by 2% over not using this term, resulting in a smoothing of the distribution profile (maximum entropy) and improved convergence of the simulated annealing protocol. The correlations between observed and predicted RDCs for these residues are shown in panel (D) Asn8, (E) Asn35, (F) Asn37.

