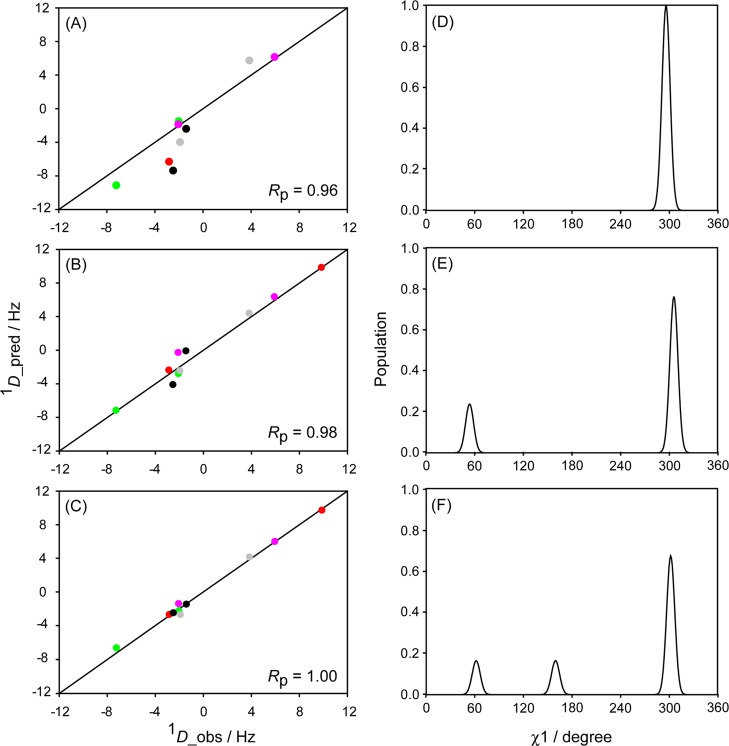
Figure 5.
Best fits between measured and predicted RDCs values for K13 under six different protein orientations for (A) single-rotamer model, (B) 2-rotamer model, (C) 3-rotamer model. All RDCs are normalized relative to the 13C–1H dipolar couplings, i.e., 1DCβCγ values are scaled up 10-fold, and all alignment strengths are scaled to DaNH = 10 Hz for the backbone RDCs. Colors correspond to the differently aligned samples (red: K19A/V42E/D47K GB3 in Pf1; green: K4A/K19E/V42E GB3 in Pf1; pink: wild-type GB3 in bicelles; gray: wild-type GB3 in PEG; black: wild-type GB3 in Pf1). Circles correspond to 1DCβHβ couplings. (D–F) The best-fitted K13 χ1 rotamers for the 1-, 2-, and 3-rotamer models.

