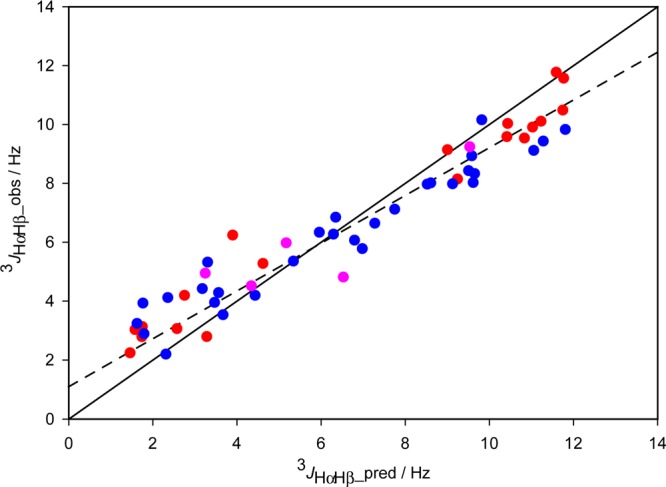
Figure 7.

Comparison of observed 3JHαHβ couplings with those predicted by the substituent-specific Karplus equations of Haasnoot et al.67 The solid line corresponds to x = y; the dashed line corresponds to values predicted by these same equations after adding Gaussian fluctuations (cf. eq 4) with a standard deviation of σ = 20° to the χ1 angles reported in Table 1. Note that to a very good approximation, the effect of σ = 20° simply scales the difference in the predicted 3JHαHβ relative to a value of ca. 6 Hz (Figure S11). The rmsd between observed and predicted 3JHαHβ values (using the σ = 20° motional model) is 0.75 Hz. 3JHαHβ values (Table S16) for residues with a single χ1 rotamer are in red, two χ1 rotamers in blue, and three rotamers in pink.
