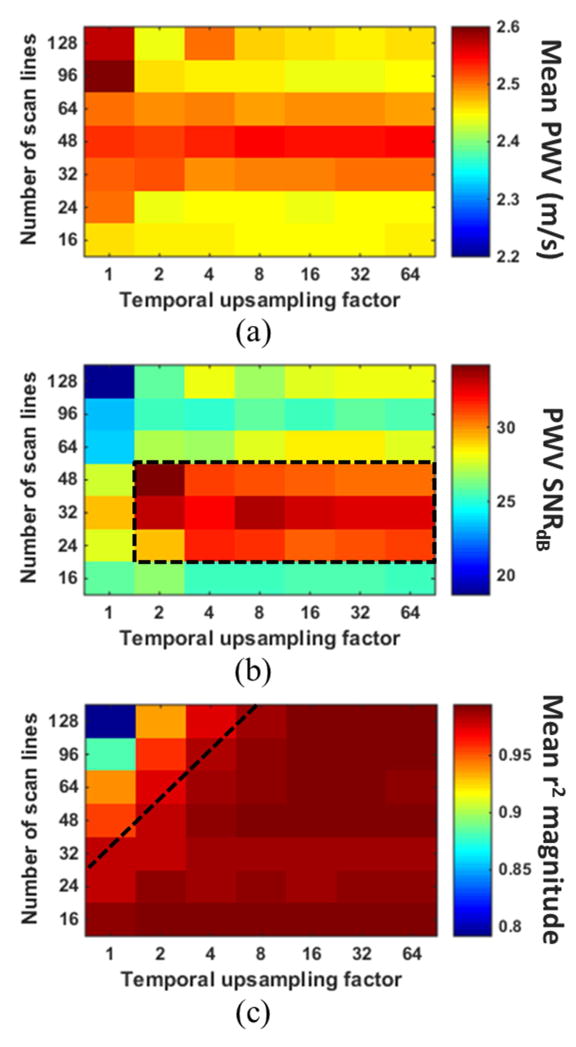
Figure 6.
(A) Mean PWV, (B) SNR of the PWV measurement, and (C) magnitude of the r2 value for each combination of scan line quantity and temporal upsampling factor in the second canine aorta. The value in each square of the grids was obtained from PWV and r2 measurements over 10 pulse cycles. The black dashed box in (B) indicates the combinations of scan line quantity and temporal upsampling factor that yielded the highest PWV SNR, while combinations below the black line in (C) resulted in saturation of the r2 magnitudes.

