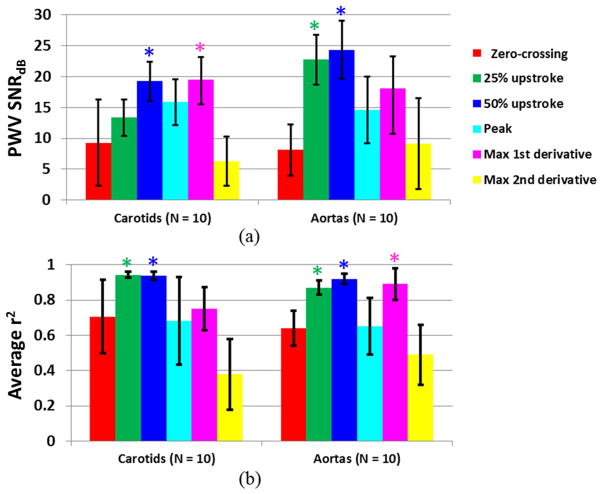
Figure 7.
(A) SNR of the PWV measurement and (B) magnitude of the r2 value from tracking each of the six waveform features (i.e. zero-crossing, 25% upstroke, 50% upstroke, peak, maximum first derivative, and maximum second derivative), averaged over n = 10 human carotid arteries and n = 10 human aortas in vivo. The PWV SNR and mean r2 for each tracking feature were obtained from averaging the PWV and r2 measurements over at least 10 cardiac cycles per subject. (*) indicates the tracking features that exhibited significantly higher (p < 0.05) PWV SNR and/or average r2 compared to the other features.

