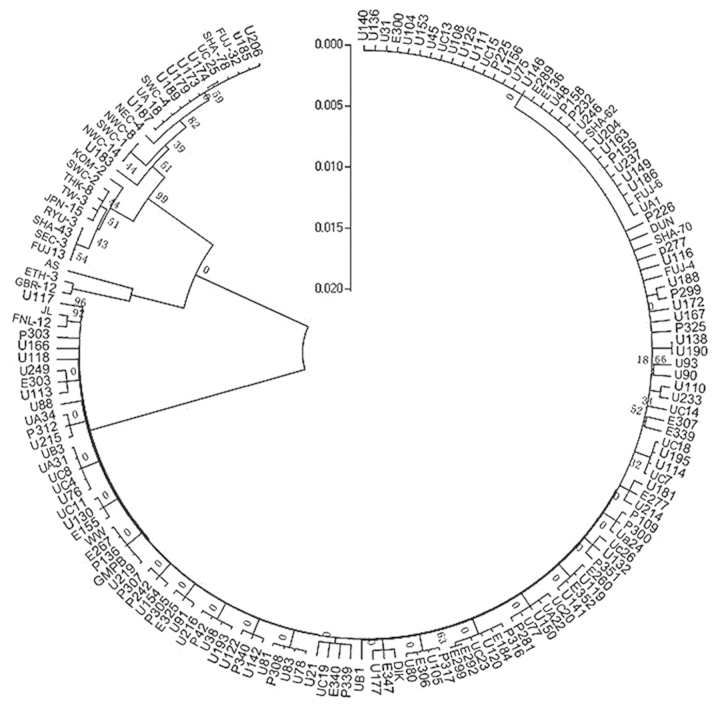
Figure 3.
Phylogenetic analysis of VP2 gene segment by NJ method two major branches were evidently shown. Whereas the BPs values of major branches ranged from 0 to 17%. And reference strains of the same subgroup couldn't be distributed into the same branch, while different ones were distributed into the same cluster.

