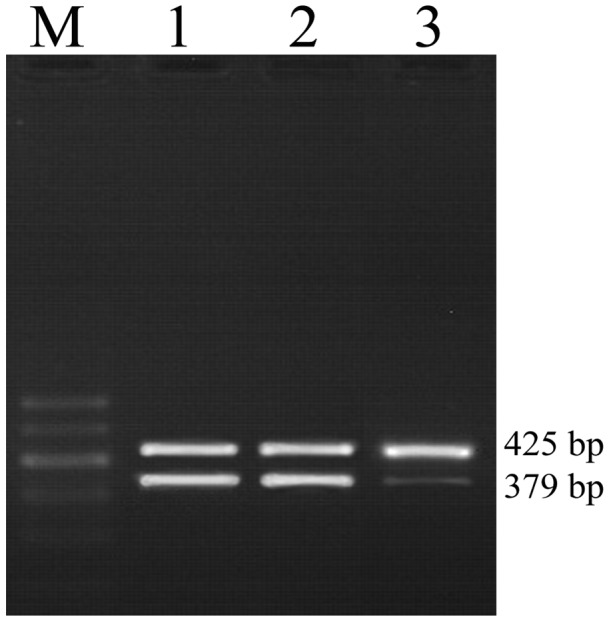
Figure 3.

RT-PCR analysis was conducted to evaluate the mRNA expression levels of RBP2 in thyroid carcinoma K1 cells transfected with RBP2-siRNA or control siRNA. The results revealed that K1 cells transfected with RBP2-siRNA (lane 3) presented lower mRNA levels of RBP2 than the blank (lane 1) and control cells (lane 2). The quantification of mRNA levels of RBP2 were normalized to levels of β-actin, and normalized using the formula 2−ΔΔCt with SYBR Green qPCR kit [Fig. 2B; (t=8.869; P=0.000)]. RBP2, retinoblastoma binding protein 2; RT-qPCR, reverse transcription-quantitative polymerase chain reaction; siRNA, small interfering RNA; RBP2-siRNA, siRNA targeting RBP2.
