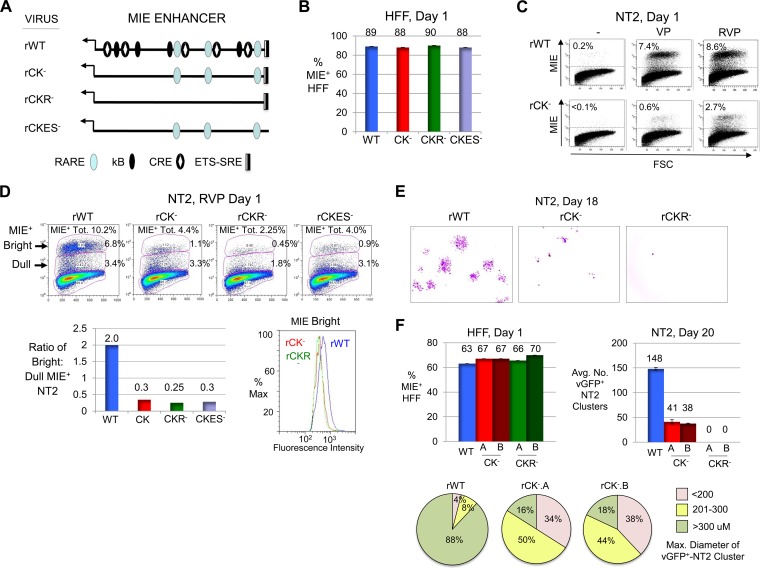
FIG 7.
CRE-kB mutations lower the initiation frequency and amplitude of RVP-induced MIE gene expression, whereas add-on RARE mutations nearly abolish viral activity later on. (A) Diagram of MIE enhancer cis-acting element types functionally neutralized by base substitution mutations in the context of recombinant HCMV genomes. Mutations were placed in CRE-kB (rCK−), CRE-kB plus RARE (rCKR−), and CRE-kB plus ETS-SRE (rCKES−). See Materials and Methods for details. (B to D) HFF (MOI, 0.8 PFU/cell) (B) and NT2 (MOI, 5.0) (C and D) were infected with rWT, rCK−, rCKR−, and/or rCKES−. FACS and FlowJo analyses were performed to characterize MIE+ HFF (20,000 gated cells) at day 1 p.i. and MIE+ NT2 (80,000 gated cells) at day 1 of stimulation with VP, RVP, or nothing. Input viral titers were adjusted to produce comparable amounts of MIE+ HFF (B). Percentages of MIE+ NT2 relative to all gated NT2 produced by VP- versus RVP-stimulated rWT and rCK− are depicted in scatter plots (C). Scatter plots of RVP-stimulated rWT, rCK−, rCKR−, and rCKES− depict the percentages of bright and dull MIE+ NT2 subsets, which make up the total MIE+ population (MIE+ Tot.) (D). The bar graph shows the ratio of bright to dull MIE+ NT2 for each of the viruses, whereas the histogram shows fluorescence intensity distributions of bright MIE D-NT2 subpopulations for rWT, rCK−, and rCKR− (D). (E) Inverted images of representative micrographs show vGFP+ NT2 clusters (pink color) for rWT, rCK−, and rCKR− at day 18 after commencement of RVP stimulation for 24 h followed by continual exposure to R; original magnification, ×4. rCKR− did not form NT2 clusters (>6 cells per cluster). The difference in input titers for the viruses was ≤3%, as determined in parallel analyses of MIE+ HFF at day 1 postinfection (not shown). (F) In a separate study, vGFP+ NT2 cluster formation (>6 cells per cluster) was analyzed for rWT, rCK−.A, rCK−.B, rCKR−.A, and rCKR−.B at day 20 after RVP stimulation followed by continual exposure to R, in relation to percentages of MIE+ HFF at 1 day p.i. The average number (Avg. No.) of clusters was determined from two separate infections. Size distributions of 50 randomly selected vGFP+ NT2 clusters are depicted by category of range in diameters.

