FIG 8.
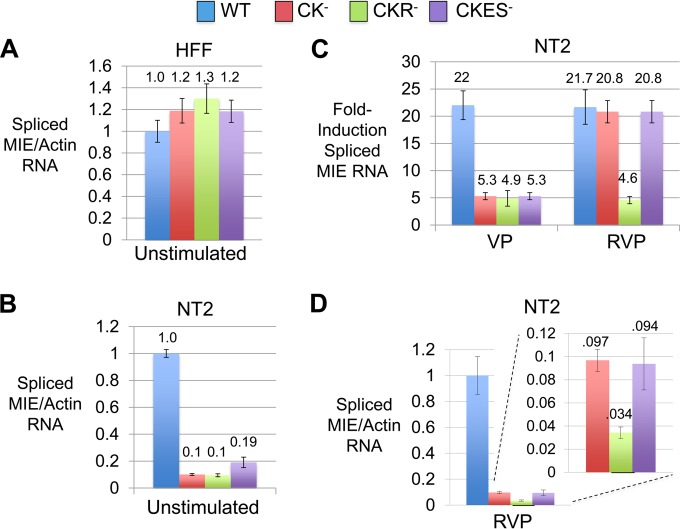
CRE-kB mutations lower pre- and postinduction MIE RNA levels, whereas add-on RARE mutations blunt the inducible response. (A to D) HFF (MOI, 1.0 PFU/cell) (A) and NT2 (MOI, 5.0) (B to D) were infected in parallel with rWT, rCK−, rCKR−, and rCKES−. HCMV spliced MIE RNA level was quantified by RT-qPCR in triplicate biological samples at 4 h after HFF infection and at 4 h after stimulation of quiescently infected NT2 with VP, RVP, or nothing (Unstimulated). Bar graphs in panels A, B, and D depict spliced MIE RNA levels relative to that produced by rWT after normalization to cellular actin RNA amount (means ± SD). The panel C bar graph depicts fold changes in levels of spliced MIE RNA before and after stimulation for the respective virus type, normalized to actin RNA levels (means ± SD). RNA levels were quantified using TaqMan and standard curve methods.

