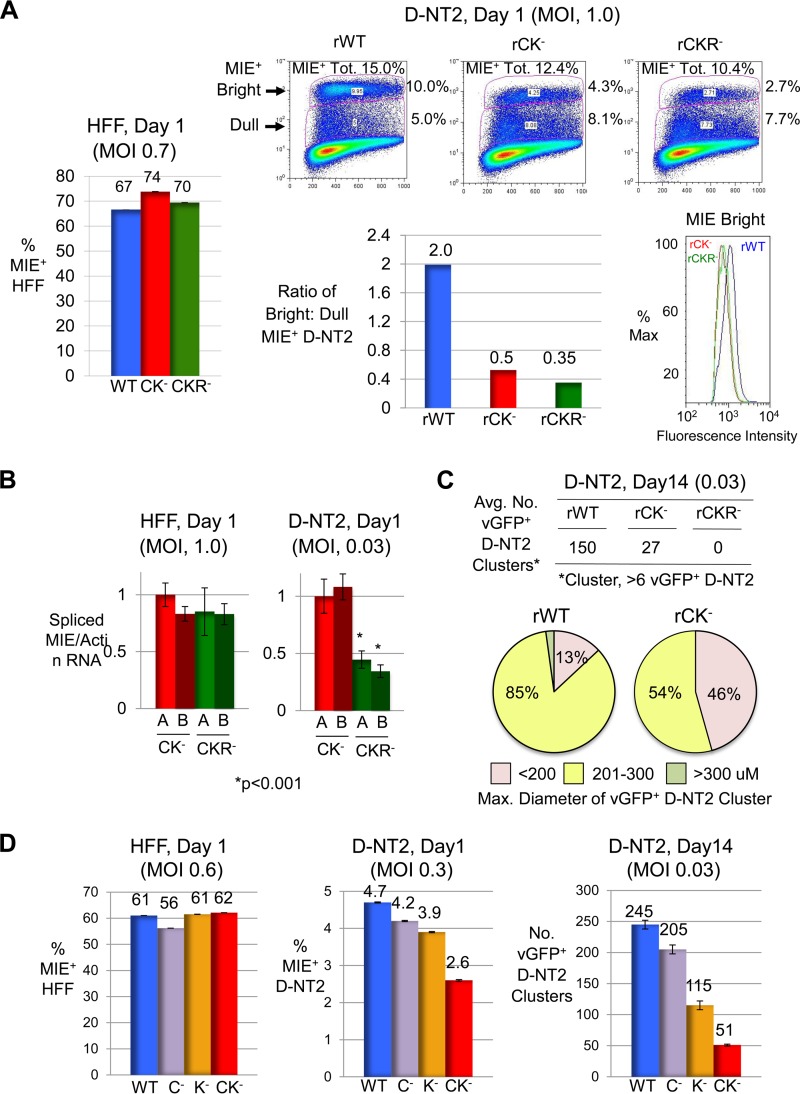
FIG 9.
Abnormalities caused by CRE-kB and add-on RARE mutations also manifest in D-NT2. (A) HFF (MOI, 0.7 PFU/cell) and D-NT2 (MOI, 1.0) were infected with rWT, rCK−, and rCKR− in the absence of R exposure. FACS was applied at day 1 p.i. to determine the percentages of MIE+ cells. Scatter plots show percentages of 250,000 gated cells in bright and dull MIE+ −D-NT2 subsets, which make up the total MIE+ population (MIE+ Tot.). The bar graph depicts the ratio of bright to dull MIE+ D-NT2. The histogram shows the fluorescence intensity profile for the MIEBright D-NT2 population. (B) At 1 day p.i. with rCK−.A, rCK−.B, rCKR−.A, and rCKR−.B, spliced MIE RNA levels were quantified from triplicate infections of HFF (MOI, 1.0) and D-NT2 (MOI, 0.03) in the absence of R and normalized to actin RNA levels. (C) D-NT2 (MOI, 0.03) infected with rWT, rCK−, and rCKR− in parallel with groups shown in panel A were maintained in the presence of R for 14 days p.i. The average number (Avg. No.) of vGFP+ D-NT2 clusters (>6 vGFP+ D-NT2 per cluster) was determined for two separate infections. Size distributions of 50 randomly selected vGFP+ NT2 clusters are depicted by category of diameter size. rCKR− did not form D-NT2 clusters at day 14. (D) HFF (MOI, 0.6 PFU/cell) and D-NT2 (MOI, 0.3 and 0.03) were infected with rWT, rC−, rK−, and rCK−. FACS determined the percentage of MIE+ D-NT2 at 1 day p.i. The average numbers of vGFP+ D-NT2 clusters were determined at day 14 p.i. for two separate infections.

