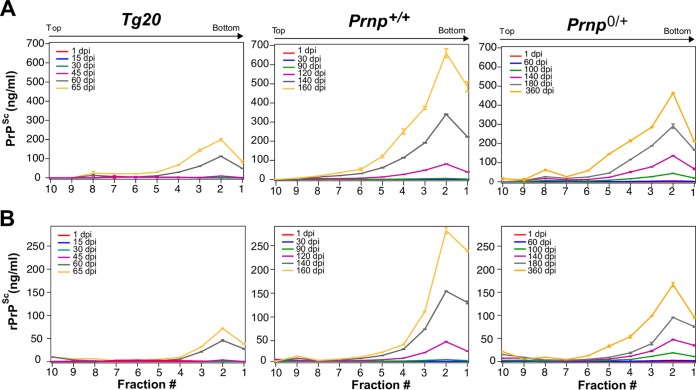
FIG 2.
Time course for the appearance of misfolded PrP isoforms in three mouse genotypes. CDI analyses of gradient fractions from brains of mice of three genotypes (Tg20, Prnp+/+, and Prnp0/+) plotted versus different times after inoculation with the RML prion isolate to represent the gradient profiles for total PrPSc (A) and rPrPSc (B) after PK treatment. Time points (dpi) of the source material are indicated within each panel by color codes. Each data point is an average ± the SEM. of triplicate independent CDI measurements in three to four mice brains. CDI values for 30 and 45 dpi for Tg20 mice were below assay threshold and are not presented.

