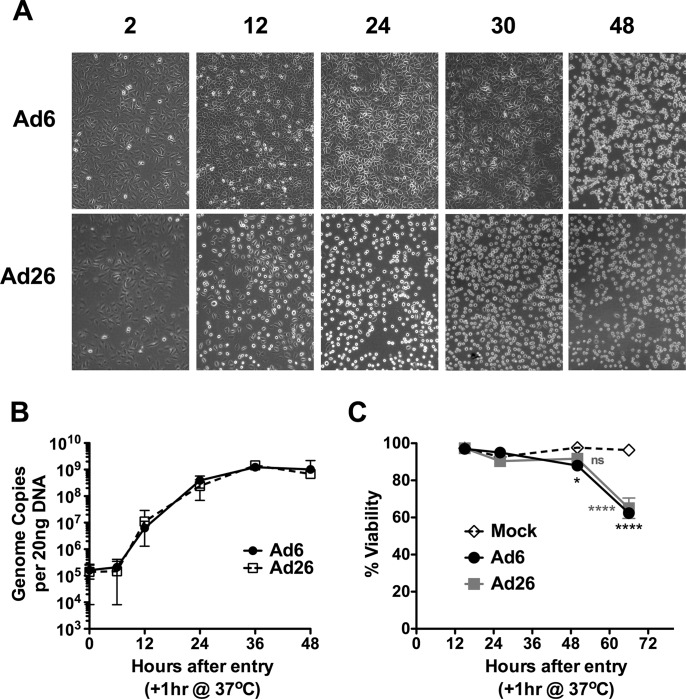
FIG 2.
Ad6 and Ad26 infection of A549 cells. (A) A549 cells were infected with 1,000 vp/cell of Ad6 or Ad26 and imaged over time. (B) Time course of detection of Ad genomes in A549 cells 0, 6, 12, 24, 36, and 48 h after infection with 10,000 vp per cell. Twenty nanograms of DNA was evaluated by qPCR at each time. Averages and standard errors for three independent experiments are shown. (C) Viability of infected A549 cells (10,000 vp per cell) evaluated by a propidium iodide exclusion assay. Averages and standard errors for three replicates are shown (*, P < 0.05; ****, P < 0.001; ns, not significant).

