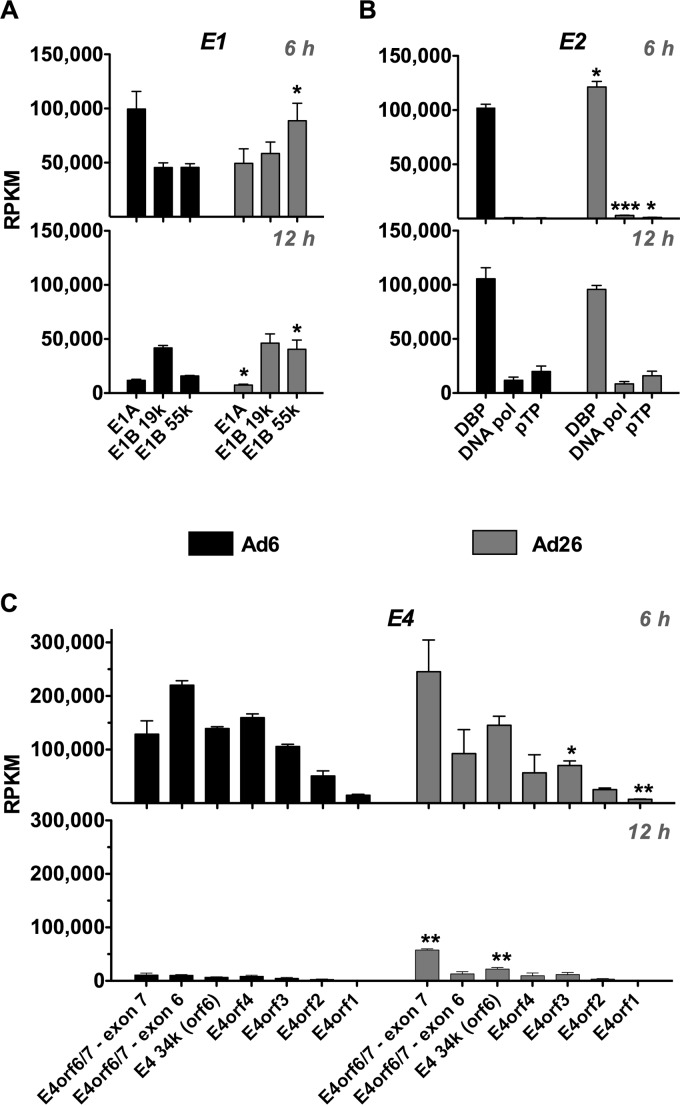
FIG 6.
mRNA expression across E1, E2, and E4 coding regions. Quantification of RPKM values for ORFs in E1 (A), E2 (B), and E4 (C) is shown. RPKM values were calculated for 6-h (top) and 12-h (bottom) time points. Ad6 is shown in black, and Ad26 is shown in gray (see Materials and Methods and Table 2 for quantification methods and base pair coordinates for defined regions). Averages and standard errors for three data sets are shown. Significance between Ad6 and Ad26 values was determined by an unpaired 2-tailed t test (*, P < 0.05; **, P < 0.01; ***, P < 0.001).

