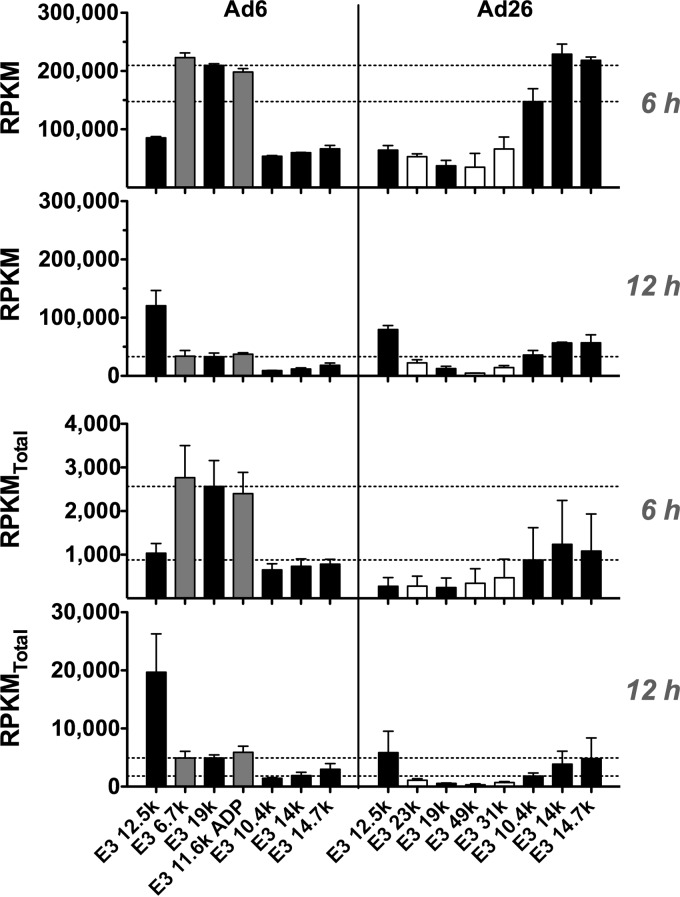
FIG 8.
mRNA expression across Ad6 and Ad26 E3 genes at 6 h and 12 h. (Top) RPKM values calculated for the 6-h (top) and 12-h (bottom) time points, as indicated in Materials and Methods, by using the sequence definitions given in Table 2. (Bottom) RPKMtotal values calculated based on total reads as opposed to viral reads and represented as described above. Averages and standard errors for three data sets are shown. Significance between Ad6 and Ad26 values was determined by an unpaired 2-tailed t test.

