
Fig. 1.
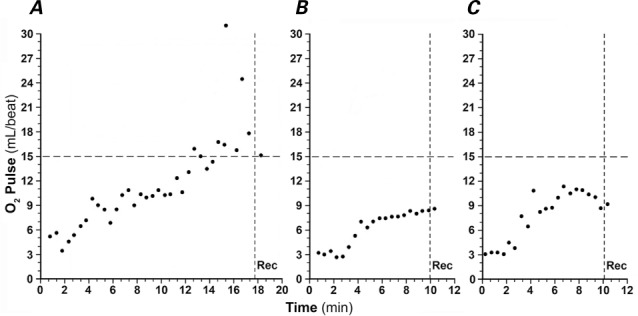
Representative oxygen (O2) pulse curves depict A) a normal O2 pulse rise during exercise; B) an abnormal O2 pulse with achievement of peak O2 pulse before peak exercise, followed by a plateau as the patient continues to exercise, which is consistent with dyspnea caused by cardiac output limitation; and C) an abnormal O2 pulse with achievement of peak O2 pulse before peak exercise, followed by a drop in O2 pulse as the patient continues to exercise, which indicates falling cardiac output. Panels B and C can be seen in patients with cardiac output limitation.
Rec = recovery period after exercise