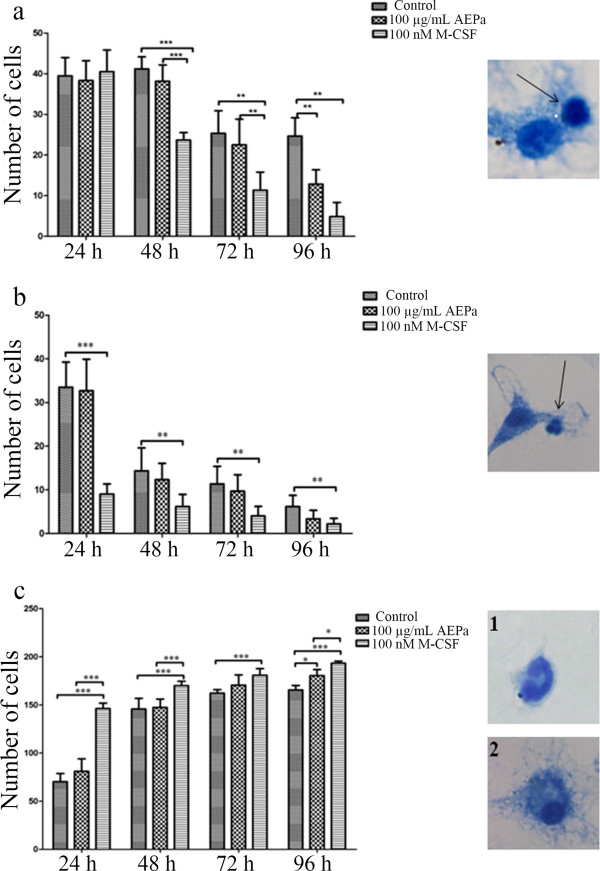
Figure 2.

Differential cell count in BMCs cultures after 24, 48, 72 and 96 hours. Cells were treated with 100 μg/mL of AEPa, 100 nM of M-CSF and compared to the control group. a) Lymphocytes. Inset, lymphocytes (arrow), cells with a small cytoplasmic area and large nucleus. b) Polymorphonuclear. Inset, showing polymorphonuclear (arrow), cells with two or more nuclei arranged in the cytoplasm. c) Mononuclear phagocytes. Inset 1, showing monocyte, cell with a small cytoplasmic area and nucleus in a horseshoe shape and, inset 2 showing macrophage, cell with a large nucleus and evident cytoplasm. The values are expressed as means ± SD and compared with the control group. ANOVA, followed by Tukey test, p <0.05.
