Figure 5.

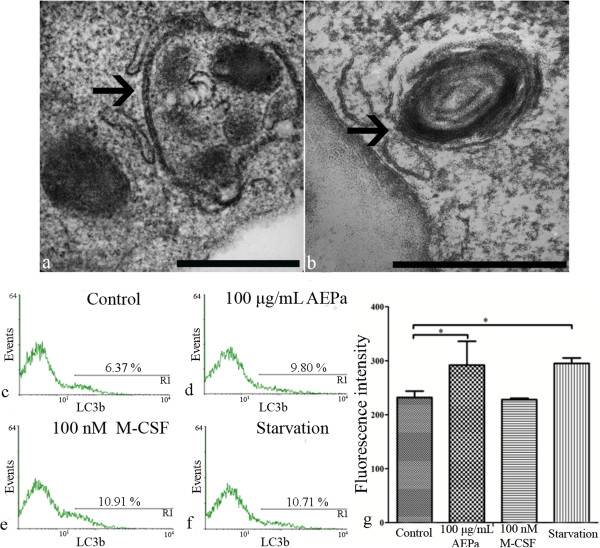
Detection of autophagic process in BMCs. Treated cells were incubated for 96 hours. a-b) Ultrastructural analysis of BMCs treated with AEPa. Cells treated with AEPa presented autophagic vacuoles in the cytoplasm (arrows). Bars: 0.5 μm. c) Untreated control. d) Cells treated with 100 μg/mL AEPa. e) Cells treated with 100 nM M-CSF. f) Starvation. g) Fluorescence intensity of BMCs stained with LC3b. ANOVA followed by Tukey test, p <0.05.
